
 Repository
Current collected state Current
Observed since 20 Oct, 17:17 UTC
No superseded metadata states collected. Unchanged observations do not create new revisions.
Cross section analysis of composite material beams of any shape.
A Python package for the cross section analysis of composite material beams of any shape.
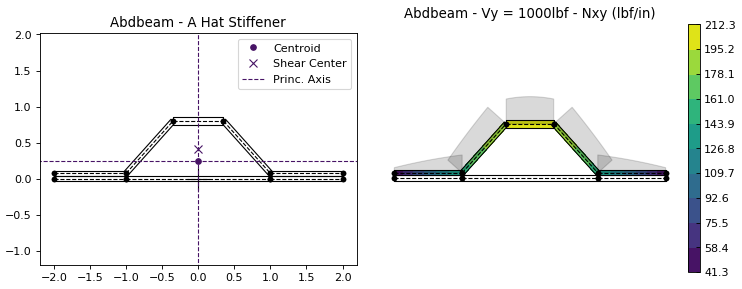
These are a few things you can do with Abdbeam:
Install using PyPI (Python package index) :
pip install abdbeam
The source code is hosted on GitHub at https://github.com/victorazzo/abdbeam and the documentation can be found at https://docs.abdbeam.org.
Let's use Abdbeam to analyze the cross section with two closed cells below:
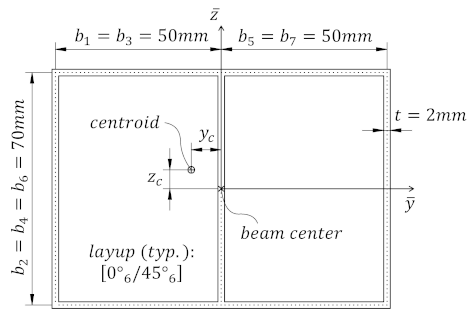
Start creating the section materials, its points and segments (we'll also calculate the section properties and request a summary at the end):
import abdbeam as ab
sc = ab.Section()
# Create a materials dictionary:
mts = dict()
mts[1] = ab.Laminate()
ply_mat = ab.PlyMaterial(0.166666, 148000, 9650, 4550, 0.3)
mts[1].ply_materials[1] = ply_mat
mts[1].plies = [[0,1]]*6 + [[45,1]]*6
# Create a points dictionary based on Y and Z point coordinates:
pts = dict()
pts[1] = ab.Point(0, -35)
pts[2] = ab.Point(-50, -35)
pts[3] = ab.Point(-50, 35)
pts[4] = ab.Point(0, 35)
pts[5] = ab.Point(50, 35)
pts[6] = ab.Point(50, -35)
# Create a segments dictionary referencing point and material ids:
sgs = dict()
sgs[1] = ab.Segment(1,2,1)
sgs[2] = ab.Segment(2,3,1)
sgs[3] = ab.Segment(3,4,1)
sgs[4] = ab.Segment(4,1,1)
sgs[5] = ab.Segment(4,5,1)
sgs[6] = ab.Segment(5,6,1)
sgs[7] = ab.Segment(6,1,1)
# Point the dictionaries to the section
sc.materials = mts
sc.points = pts
sc.segments = sgs
# Calculate and output section properties
sc.calculate_properties()
sc.summary()
Which prints:
Section Summary
===============

Number of points: 6
Number of segments: 7
Number of cells: 2

Centroid
--------
yc     = -2.67780636e-01
zc     = 0.00000000e+00

Shear Center
------------
ys     = 2.35301214e-03
zs     = -1.45758049e-03

Replacement Stiffnesses
-----------------------
EA     = 6.80329523e+07
EIyy   = 5.24834340e+10
EIzz   = 8.36408748e+10
EIyz   = 0.00000000e+00
GJ     = 1.23762317e+10
EImax  = 8.36408748e+10
EImin  = 5.24834340e+10
Angle  = 0.00000000e+00

[P_c] - Beam Stiffness Matrix at the Centroid
---------------------------------------------
[[ 6.80329523e+07  0.00000000e+00  2.46320132e+05 -1.43701515e+08]
 [ 0.00000000e+00  5.24834340e+10  0.00000000e+00  0.00000000e+00]
 [ 2.46320132e+05  0.00000000e+00  8.36408748e+10 -2.12142163e+07]
 [-1.43701515e+08  0.00000000e+00 -2.12142163e+07  1.23762317e+10]]

[W_c] - Beam Compliance Matrix at the Centroid
----------------------------------------------
[[1.50683149e-08 0.00000000e+00 1.66286490e-28 1.74959530e-10]
 [0.00000000e+00 1.90536313e-11 0.00000000e+00 0.00000000e+00]
 [1.57282135e-25 0.00000000e+00 1.19558821e-11 2.04936911e-14]
 [1.74959530e-10 0.00000000e+00 2.04936911e-14 8.28315446e-11]]

[P] - Beam Stiffness Matrix at the Origin
-----------------------------------------
[[ 6.80329523e+07  0.00000000e+00 -1.79715871e+07 -1.43701515e+08]
 [ 0.00000000e+00  5.24834340e+10  0.00000000e+00  0.00000000e+00]
 [-1.79715871e+07  0.00000000e+00  8.36456213e+10  1.72662667e+07]
 [-1.43701515e+08  0.00000000e+00  1.72662667e+07  1.23762317e+10]]

[W] - Beam Compliance Matrix at the Origin
------------------------------------------
[[1.50691722e-08 0.00000000e+00 3.20155371e-12 1.74965018e-10]
 [0.00000000e+00 1.90536313e-11 0.00000000e+00 0.00000000e+00]
 [3.20155371e-12 0.00000000e+00 1.19558821e-11 2.04936911e-14]
 [1.74965018e-10 0.00000000e+00 2.04936911e-14 8.28315446e-11]]
Now let's create two load cases (101 and 102) and calculate their internal loads:
sc.loads = dict()
sc.loads[101] = ab.Load(My=5e6)
sc.loads[102] = ab.Load(Tx=250000, Vz=5000.0)
sc.calculate_internal_loads()
Next print all internal loads (which outputs a lot of data we'll not show here):
sc.print_internal_loads()
Or access the Pandas dataframe containing these internal loads directly:
df = sc.sgs_int_lds_df
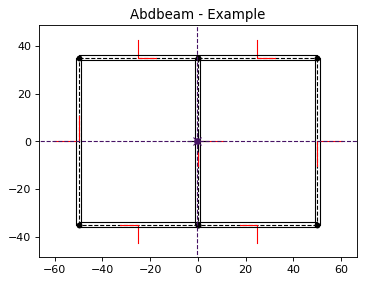
Next plot the cross section and its properties (we'll show the segment orientations, hide legends, change the centroid , shear center and principal axis colors and use a custom figure size):
ab.plot_section(sc, segment_coord=True, title='Abdbeam - Example',
                legend=False, prop_color='#471365', figsize=(5.12, 3.84))
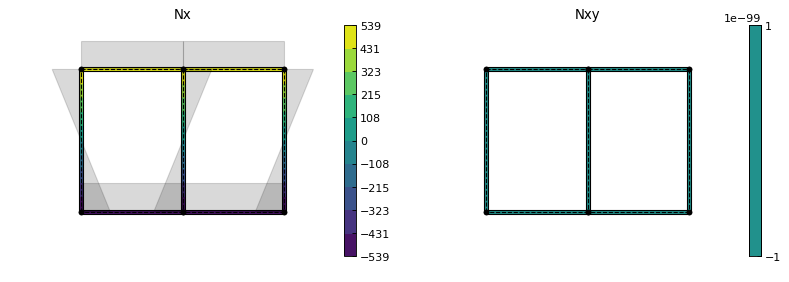
Finally, plot Nx and Nxy for load case 101 (we'll change the matplotlib contour palette, reduce the internal load diagram scale, and use a custom figure size):
ab.plot_section_loads(sc, 101, contour_color='viridis', diagram_scale=0.7,
                      int_load_list=['Nx', 'Nxy'], figsize=(5.12, 3.84))
BSD-3
Abdbeam is at its early development stages and we encourage you to pitch in and contribute on GitHub. Guidelines for contributors are in the works, so stay tuned.
For the theory behind Abdbeam, the most complete reference is:
These are also great references on its originating theory:
Note: the effects of shear deformation and restrained warping are assumed negligible in Abdbeam. Check the references above for more details.
Download counts and popularity will appear here as the collector receives them.
| Version | Published | Direct dependencies | Open version |
|---|---|---|---|
| 0.2.1 | 11 Feb 2019 | 0 |
This describes our collected data; it is not a security assessment.
Observed since 20 Oct, 17:17 UTC
No superseded metadata states collected. Unchanged observations do not create new revisions.
package:6fb5bd984efa0ca11e97e1fd02106cdad9c1d7946c11abb2f8c9b02dc583a9bd