



 Repository
Current collected state Current
Observed since 20 Oct, 18:46 UTC
No superseded metadata states collected. Unchanged observations do not create new revisions.
A package to fit functions on data





Package allowing to fit any mathematical function to (for now 1-D only) data.
pip install adadjust
from adadjust import Function
import numpy as np
import matplotlib.pyplot as plt
plt.rcParams.update({"text.usetex": True})  # Needs texlive installed

nsamples = 1000
a = 0.3
b = -10
xstart = 0
xend = 1
noise = 0.01
x = np.linspace(xstart, xend, nsamples)
y = a * x ** 2 + b + np.random.normal(0, noise, nsamples)


def linfunc(xx, p):
    return xx * p[0] + p[1]


def square(xx, p):
    return xx ** 2 * p[0] + p[1]


func = Function(linfunc, "$a \\times p[0] + p[1]$")
func2 = Function(square, "$a^2 \\times p[0] + p[1]$")

params = func.fit(x, y, np.array([0, 0]))[0]
rr = func.compute_rsquared(x, y, params)

params2 = func2.fit(x, y, np.array([0, 0]))[0]
rr2 = func2.compute_rsquared(x, y, params2)

table = Function.make_table(
    [func, func2], [params, params2], [rr, rr2], caption="Linear and Square fit", path_output="table.pdf"
)
table.compile()
Function.plot(x, [func, func2], [params, params2], y=y, rsquared=[rr, rr2])
plt.gcf().savefig("plot.pdf")
NOTE : to have pretty gaphs, put the line plt.rcParams.update({"text.usetex": True}) just after you imported adadjust.
This requiers that you have TexLive full installed on your computer.
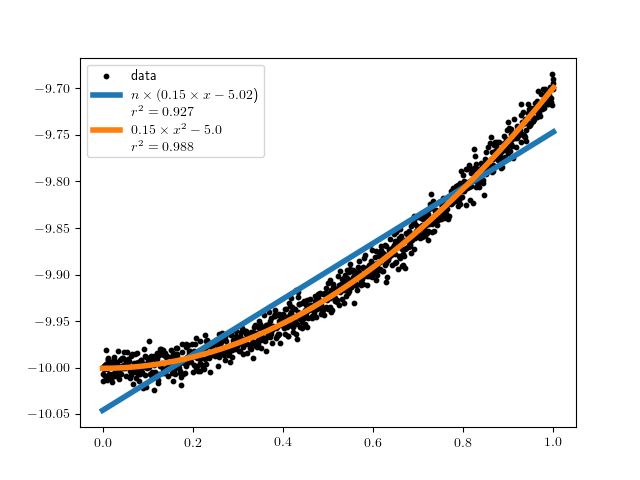
The result will be :
Download counts and popularity will appear here as the collector receives them.
| Version | Published | Direct dependencies | Open version |
|---|---|---|---|
| 0.1.46 | 20 Apr 2022 | 0 |
This describes our collected data; it is not a security assessment.
Observed since 20 Oct, 18:46 UTC
No superseded metadata states collected. Unchanged observations do not create new revisions.
package:b478096d23d162a2c8052ba089d713c048b21b8b8fcdb6b7d8d54923fd65724c