

 Repository
Current collected state Current
Observed since 20 Oct, 19:35 UTC
No superseded metadata states collected. Unchanged observations do not create new revisions.
Automated exploratory data analysis (EDA).



ADIX is a free, open-source, color-customizable data analysis tool that simplifies Exploratory Data Analysis (EDA) with a single command ix.eda(). Experience a streamlined approach to uncovering insights, empowering you to focus on your data without distraction.
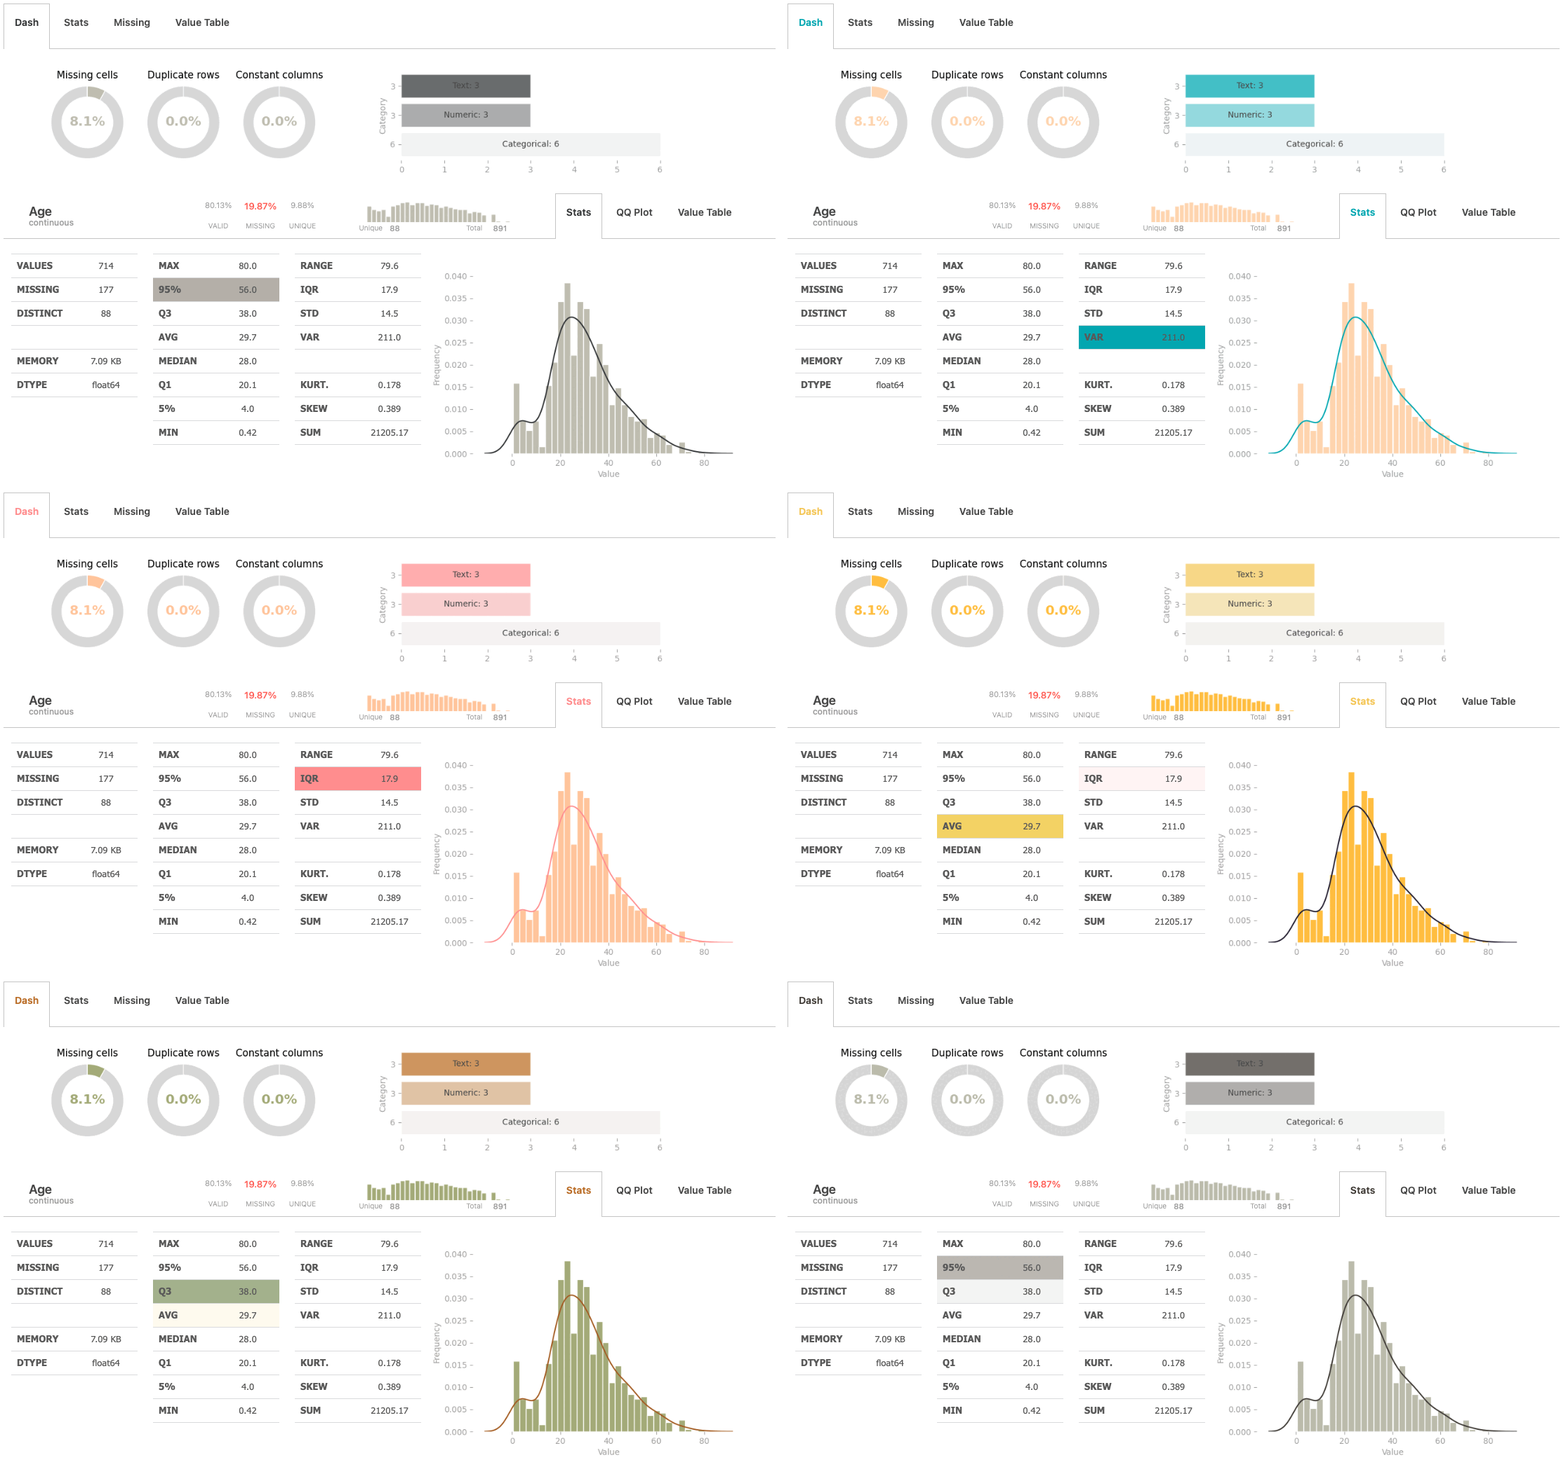
Color customization is at your fingertips, allowing you to tailor your analysis to your exact needs. Explore your data with confidence and efficiency, knowing that adix (Automatic Data Inspection and eXploration) has your back every step of the way.
The best way to install adix (other than from source) is to use pip:
pip install adix
adix is still under development If you encounter any data, compatibility, or installation issues, please don't hesitate to reach out!
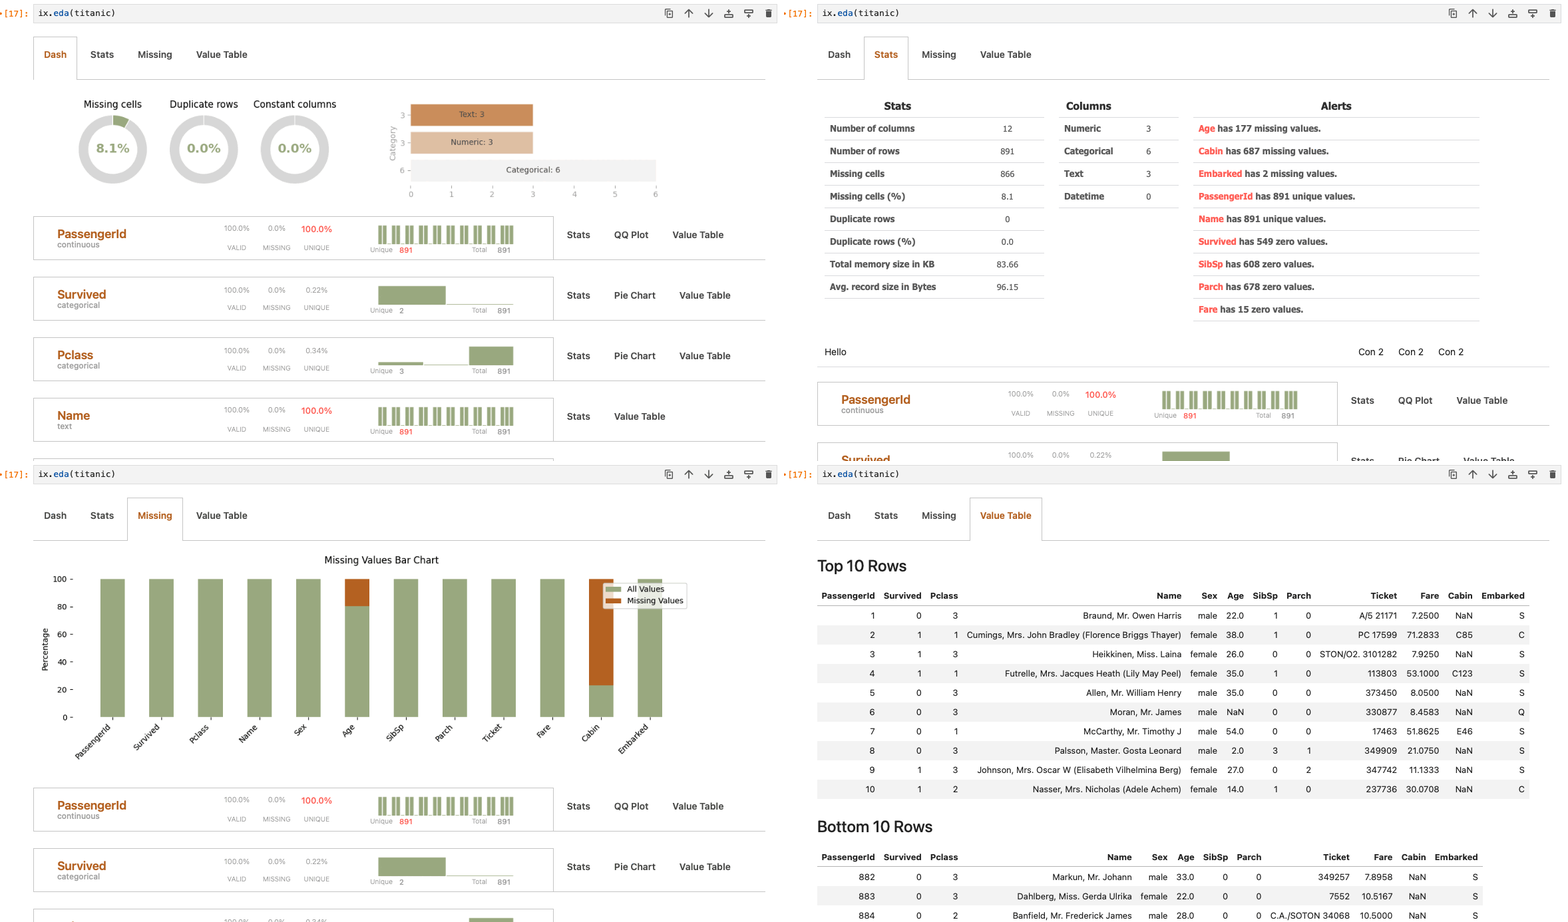
The system is designed for rapid visualization of target values and dataset, facilitating quick analysis of target characteristics with just one function ix.eda(). Similar to pandas' df.describe() function, it provides extended analysis capabilities, accommodating time-series and text data for comprehensive insights.
import adix as ix
from adix.datasets load_dataset

titanic = load_dataset('titanic')
ix.eda(titanic)
Render the DataFrame containing only categorical variables.
ix.eda(titanic,vars='categorical')
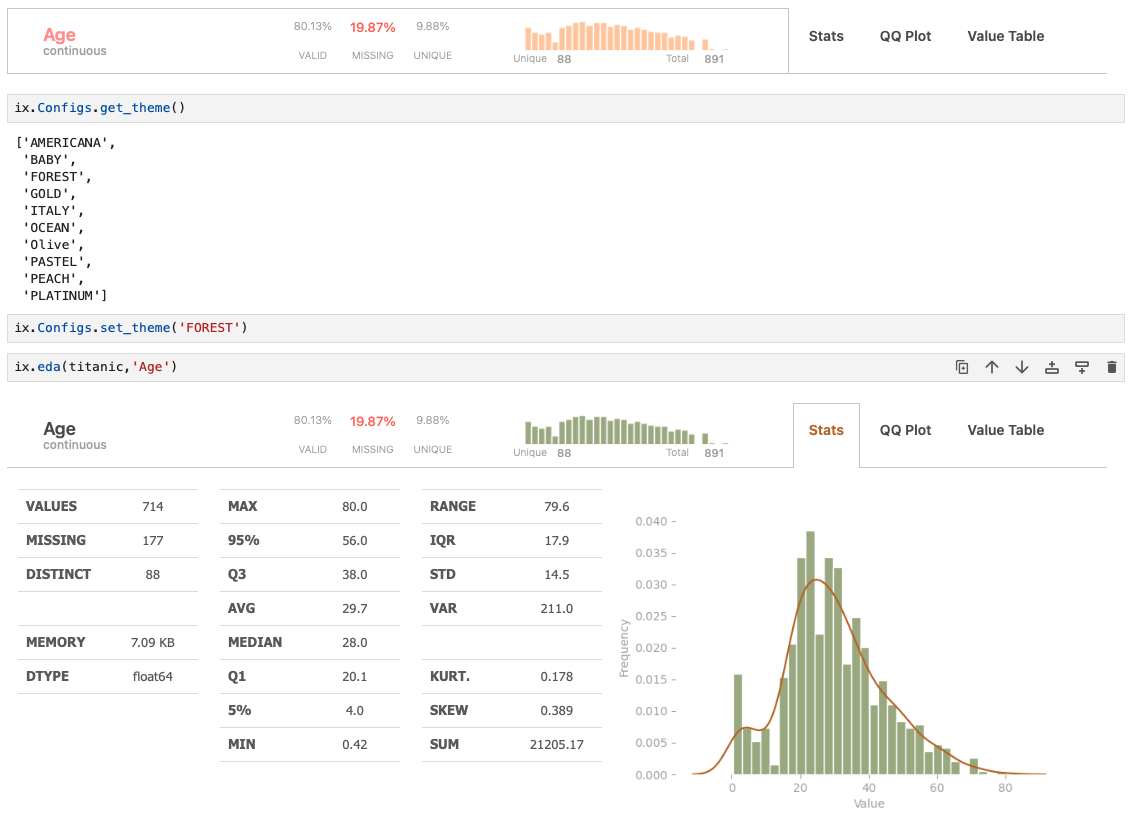
ix.eda(titanic,'Age')

An easy way to render only a part of the DataFrame you are interested in.
ix.eda(titanic.loc[:10:2,['Age','Pclass','Fare'])
ix.Configs.get_theme()
...
ix.Configs.set_theme('FOREST')
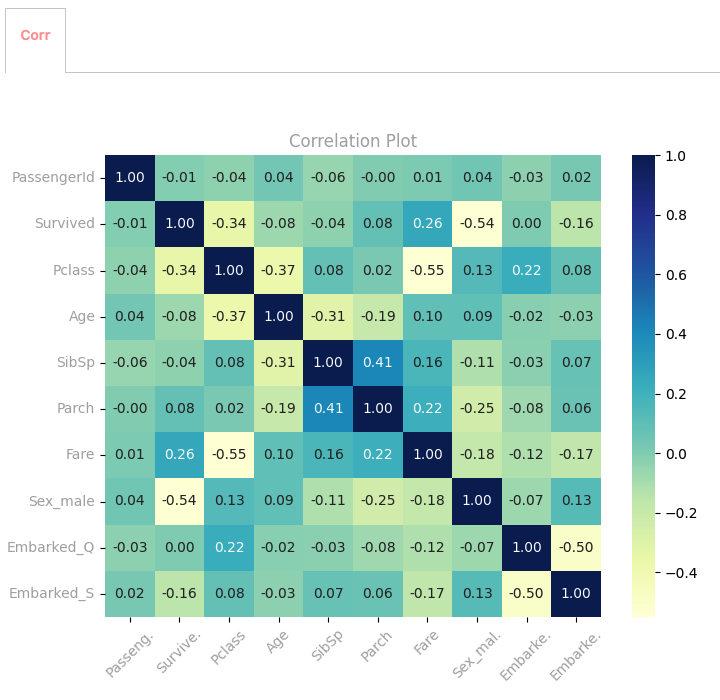
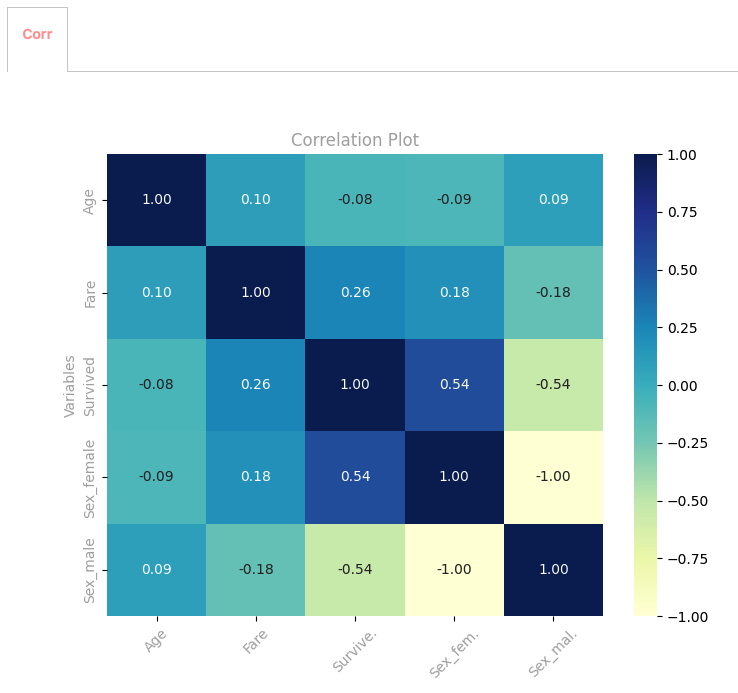
This visualization depicts the correlation between all numerical variables within the DataFrame, offering valuable insights into the magnitude and direction of their relationships.
# Show correlation for the entire DataFrame.
ix.eda(titanic,corr=True)
Furthermore, it is possible to use categorical variables since they undergo one-hot encoding to enable their inclusion in correlation analysis. It's recommended to use ANOVA. You can choose whatever variables you want to explore and analyze.
# Show correlation for selected parts of the DataFrame
ix.eda(titanic.loc[:,['Age','Fare','Sex','Survived']],vars=['categorical','continuous'],corr=True)
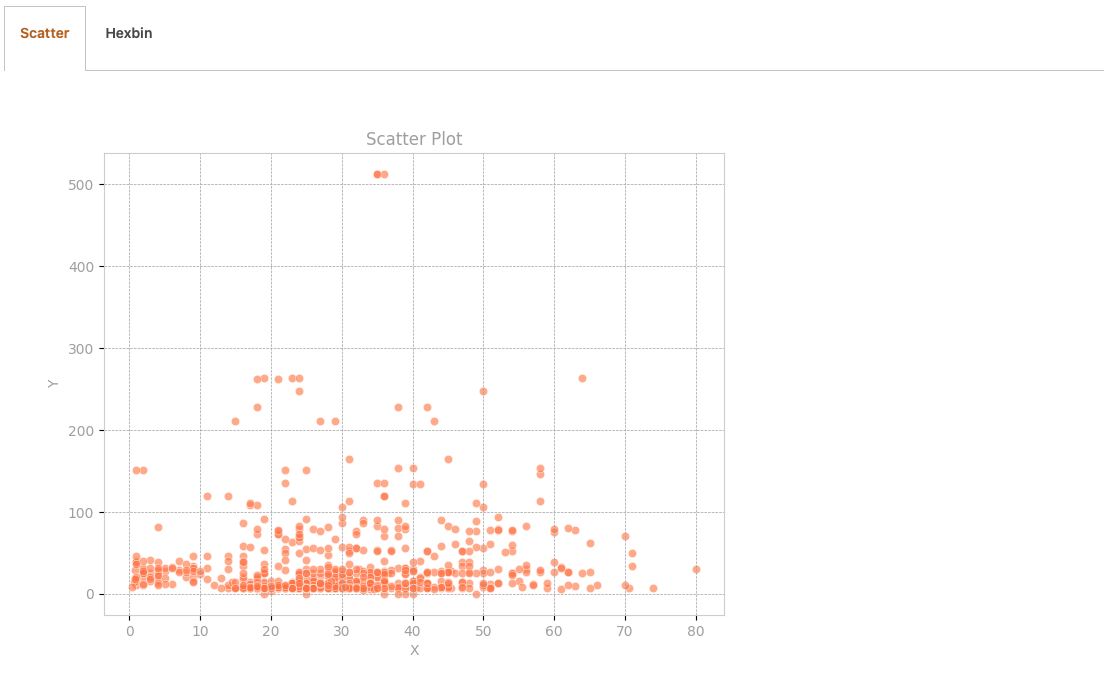
ix.eda(titanic,'Age','Fare')
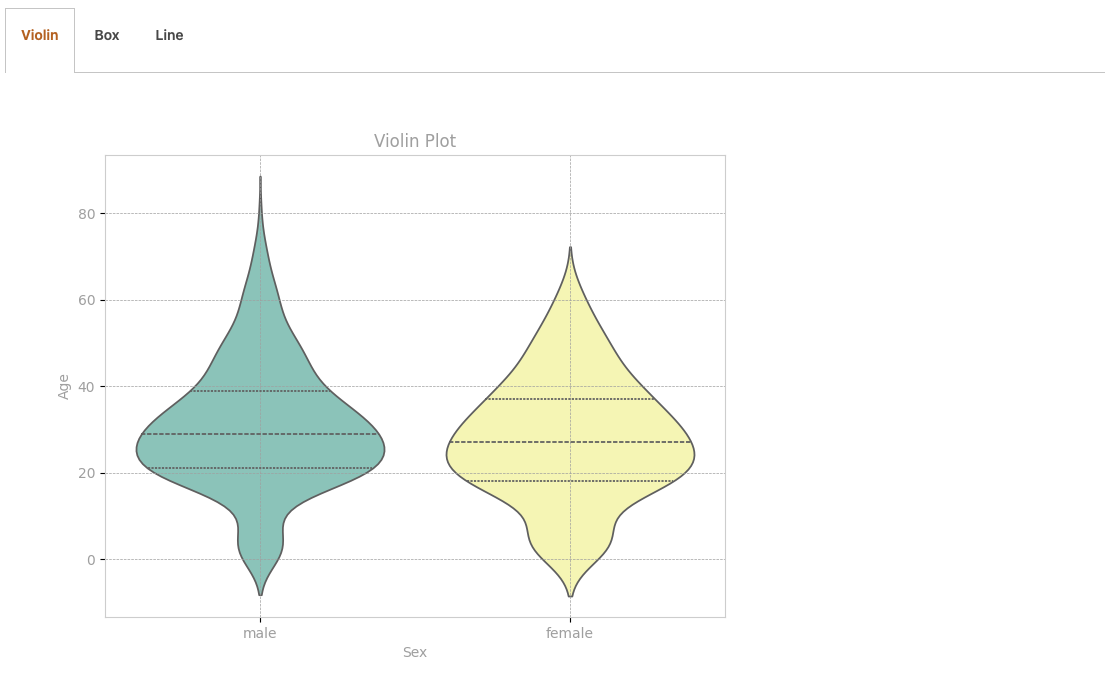
ix.eda(titanic,'Sex','Age')
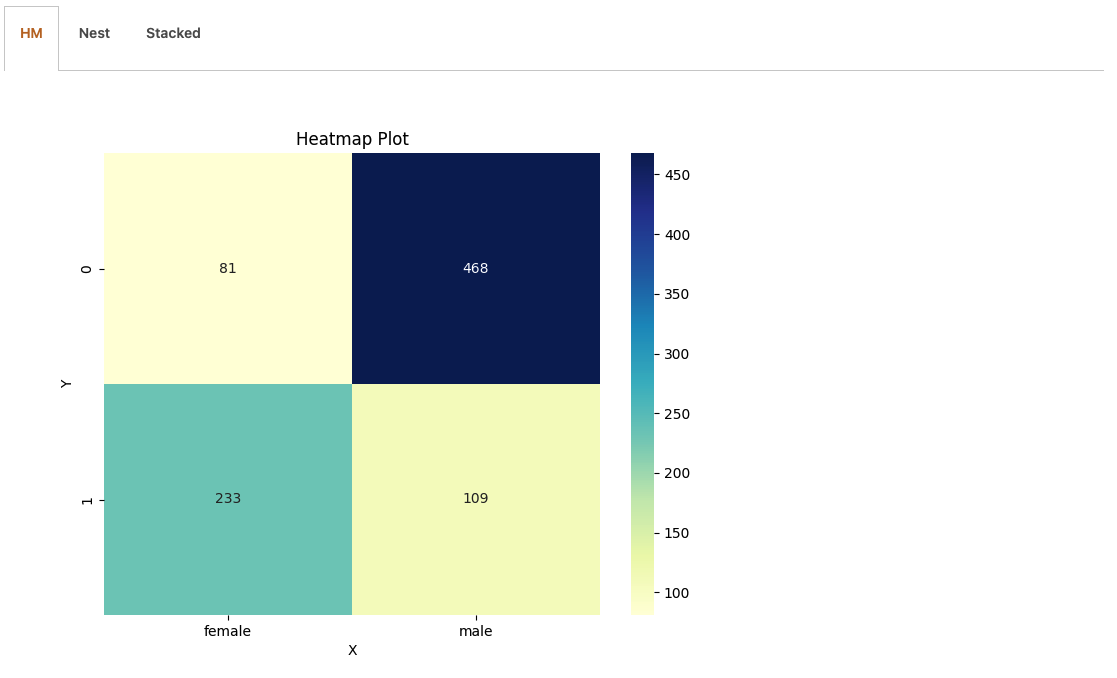
ix.eda(titanic,'Sex','Survived')
MIT
Free Software, Hell Yeah!
Contributions are welcome, so feel free to contact, open an issue, or submit a pull request!
For accessing the codebase or reporting bugs, please visit the GitHub repository.
This program is provided WITHOUT ANY WARRANTY. ADIX is still under heavy development and there might be hidden bugs.
The goal for adix is to make valuable information and visualization readily available in a user friendly environment at the click of a mouse, without reinventing the wheel. All of the libraries stated below are powerful and excellent alternatives to adix. Several functions of adix were inspired from the following:
Download counts and popularity will appear here as the collector receives them.
| Version | Published | Direct dependencies | Open version |
|---|---|---|---|
| 0.2.6 | 20 Feb 2024 | 9 |
This describes our collected data; it is not a security assessment.
Observed since 20 Oct, 19:35 UTC
No superseded metadata states collected. Unchanged observations do not create new revisions.
package:d2bed906a6282dd4ce2db7ac5f9c4878f524723f38024bcce0c9146725c8c30a