
 Repository
Current collected state Current
Observed since 21 Oct, 11:18 UTC
No superseded metadata states collected. Unchanged observations do not create new revisions.
AIME (Approximate Inverse Model Explanations) — inverse-operator XAI with publication-grade visualisations and an inverse-explanation evaluation suite.

 ]


aime_xai is a model-agnostic explainable-AI
library that explains a black-box model by building its approximate inverse
operator A†, then reading explanations backwards — from the model output
y to the input x.
The AIME methodology is detailed in the paper available at The AIME methodology is detailed in the paper available at https://ieeexplore.ieee.org/document/10247033.
From the single operator it derives global and
local feature importance, plus diagnostics no forward-problem method
(LIME/SHAP) can produce.
This edition keeps the canonical AIME mathematics unchanged and adds:
A† design language) that does not look like default matplotlib.All five are the same AIME class selected by flags; every variant works
with every visualisation. The operator math is identical to the papers.
| Variant | Construction | How to call | Reference |
|---|---|---|---|
| AIME | Moore–Penrose pseudo-inverse A† = X' Y⁺ | AIME() | Nakanishi 2023 |
| HuberAIME | Huber-loss IRLS (outlier-robust) | AIME(use_huber=True) | Nakanishi 2025 |
| RidgeAIME | ℓ2 closed form X'Yᵀ(YYᵀ+λI)⁻¹ | AIME(use_ridge=True) | Itoh & Nakanishi 2025 |
| Huber-RidgeAIME | robust and regularised | AIME(use_huber=True, use_ridge=True) | — |
| BayesianAIME | posterior mean + covariance → 95% credible intervals | AIME(use_bayesian=True) | Nakanishi 2025 |
use_bayesian cannot be combined with Huber/Ridge.
pip install aime-xai
Dependencies: numpy, pandas, scikit-learn, matplotlib (the visualisation
layer itself needs only numpy + matplotlib).
AIME is model-agnostic — it consumes the model's predict_proba, never its
internals.
import numpy as np
from aime_xai import AIME

# X_train: (N, d) inputs ;  y_hat_train = model.predict_proba(X_train): (N, m)
feature_names = column_features            # e.g. ['Age','SibSp',...,'Embarked_S']
class_names   = ['not survived', 'survived']

explainer = AIME().create_explainer(X_train, y_hat_train, normalize=True)
explainer.A_dagger.shape
(12, 2) # (n_features, n_classes) — the inverse operator A†
g = explainer.global_feature_importance(
        feature_names=feature_names, class_names=class_names)
g.round(2)        # returned DataFrame (class × feature)
               Age  SibSp  Parch  Fare  Pclass_1  Pclass_2  ...
not survived -0.05   -0.0    0.0 -0.79      -0.0     -0.02
survived      0.05    0.0   -0.0  0.79       0.0      0.02
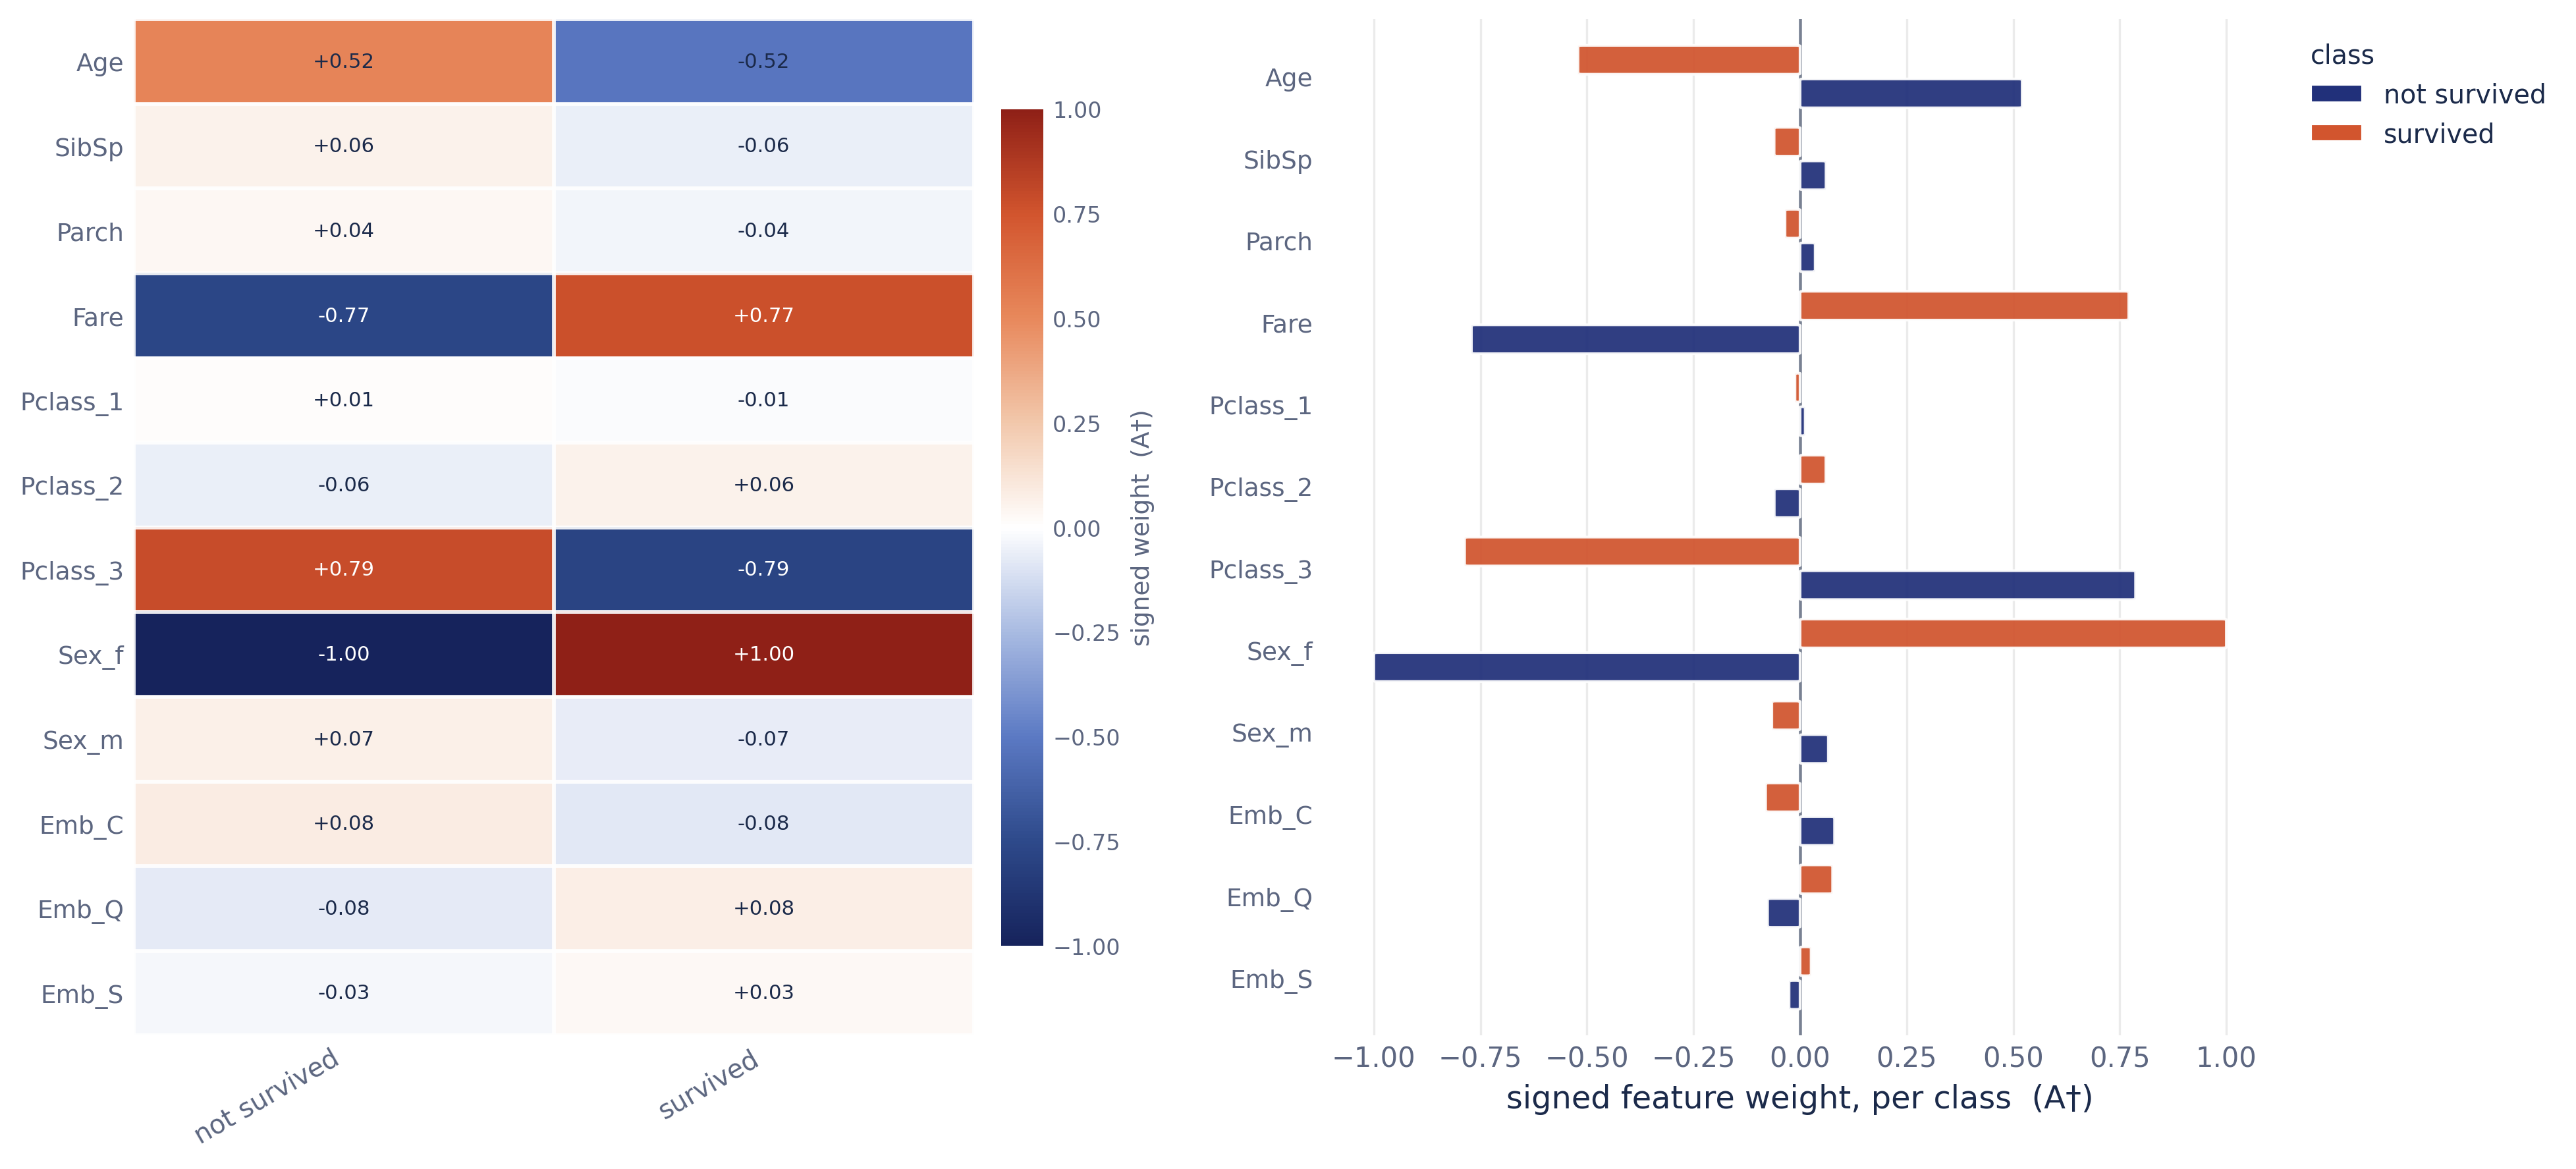
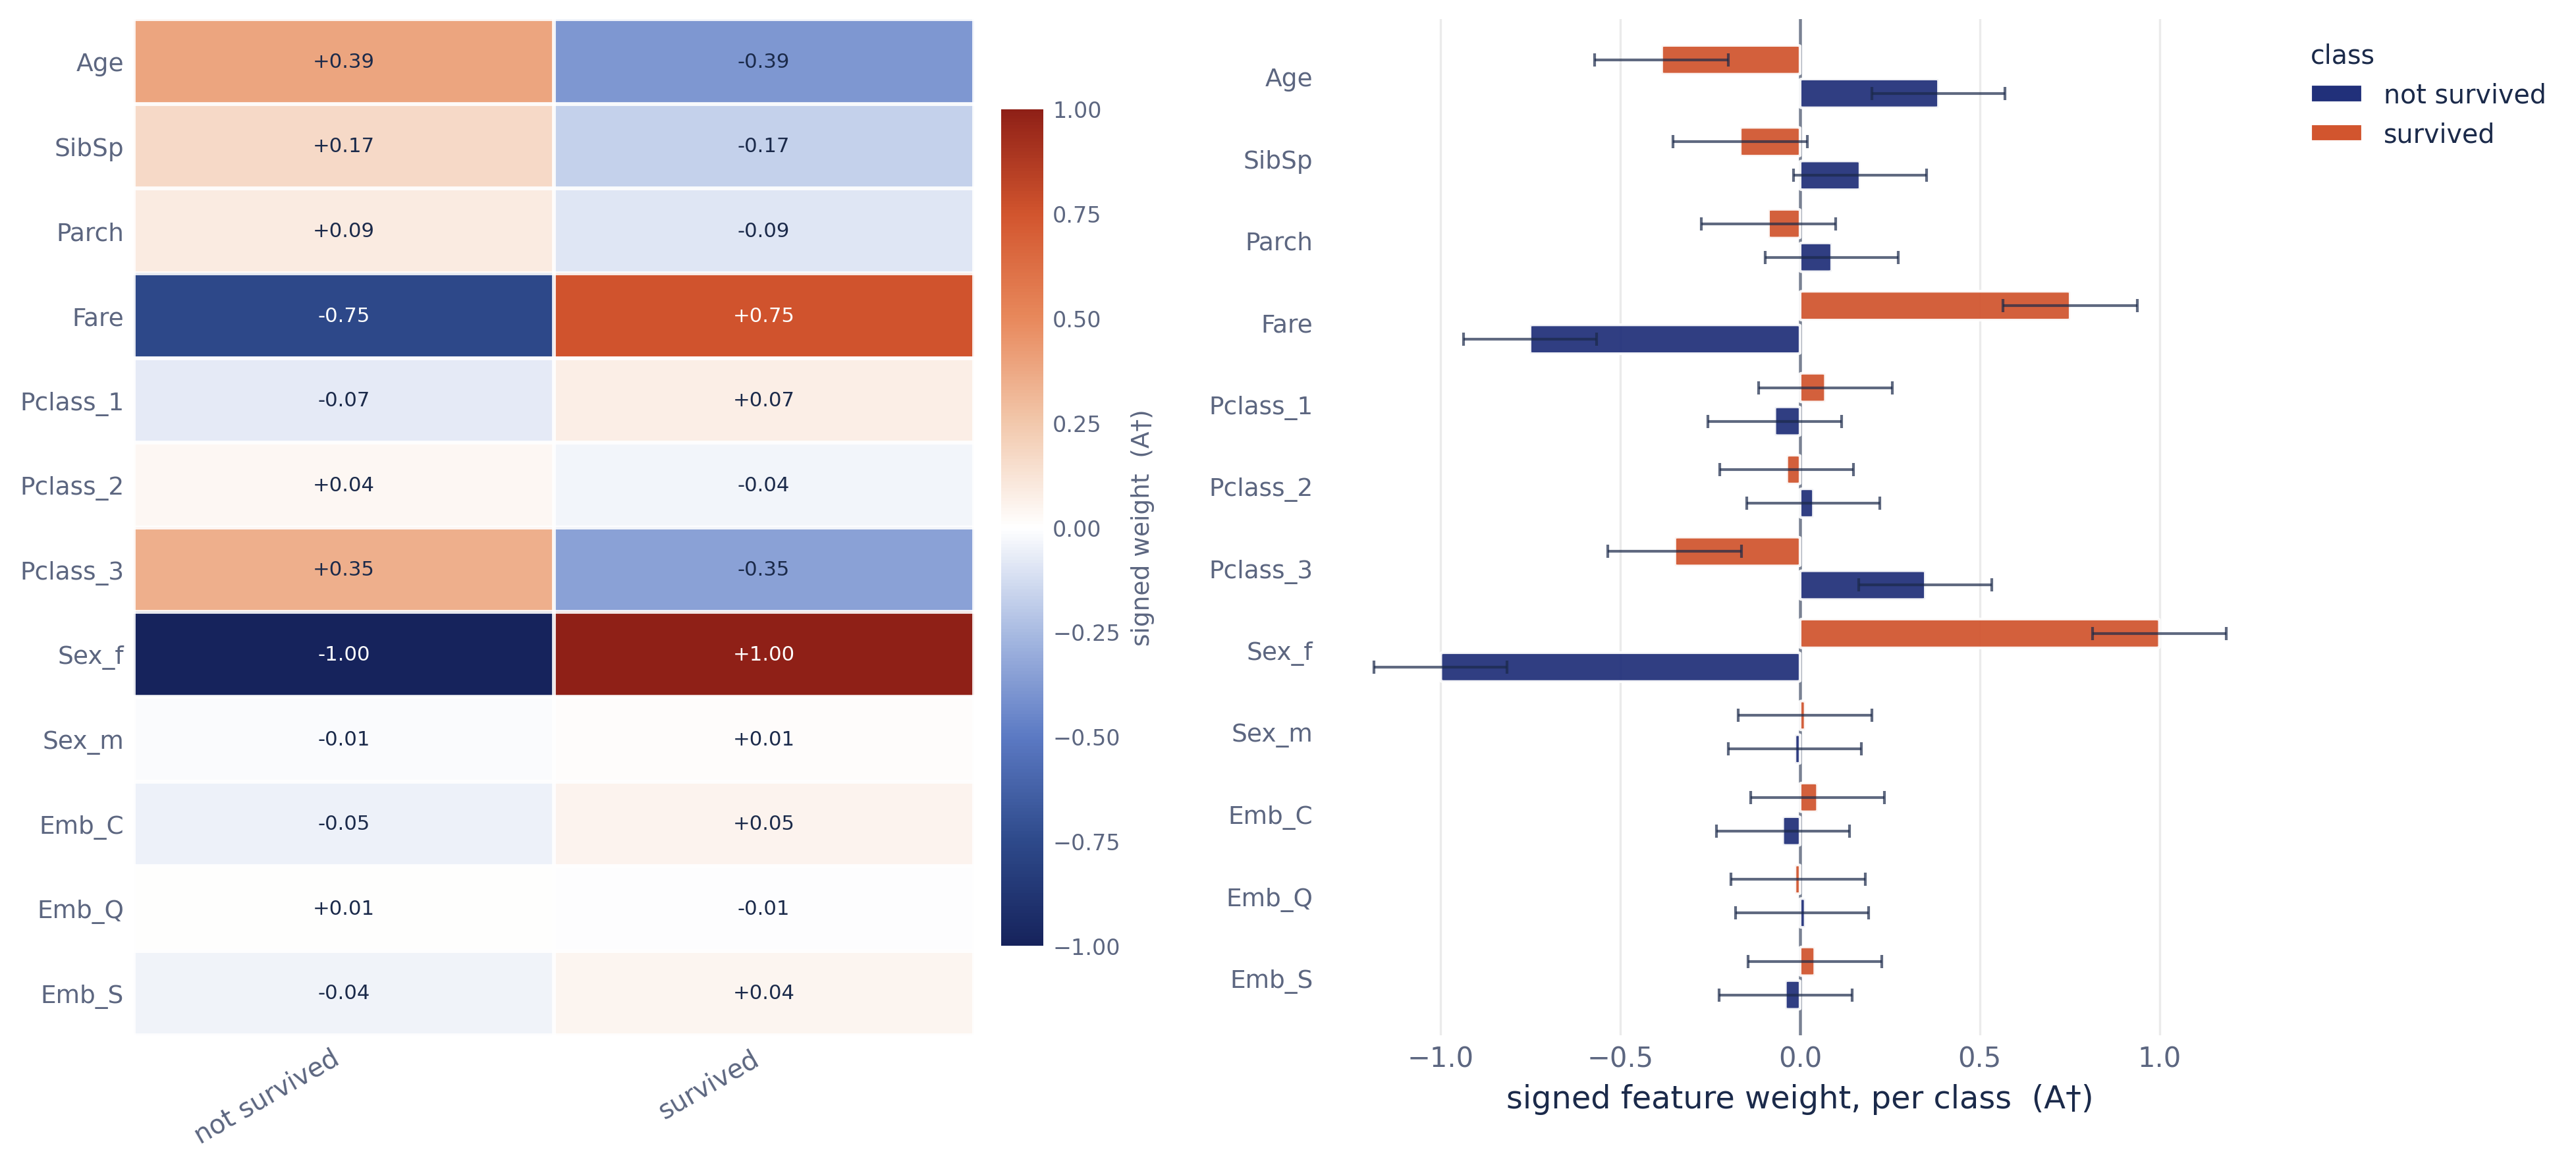
The left panel is the operator field (the signed A† matrix); the right
panel shows per-class signed weights with a class legend — AIME's signature
ability to give a distinct importance vector for every output class.
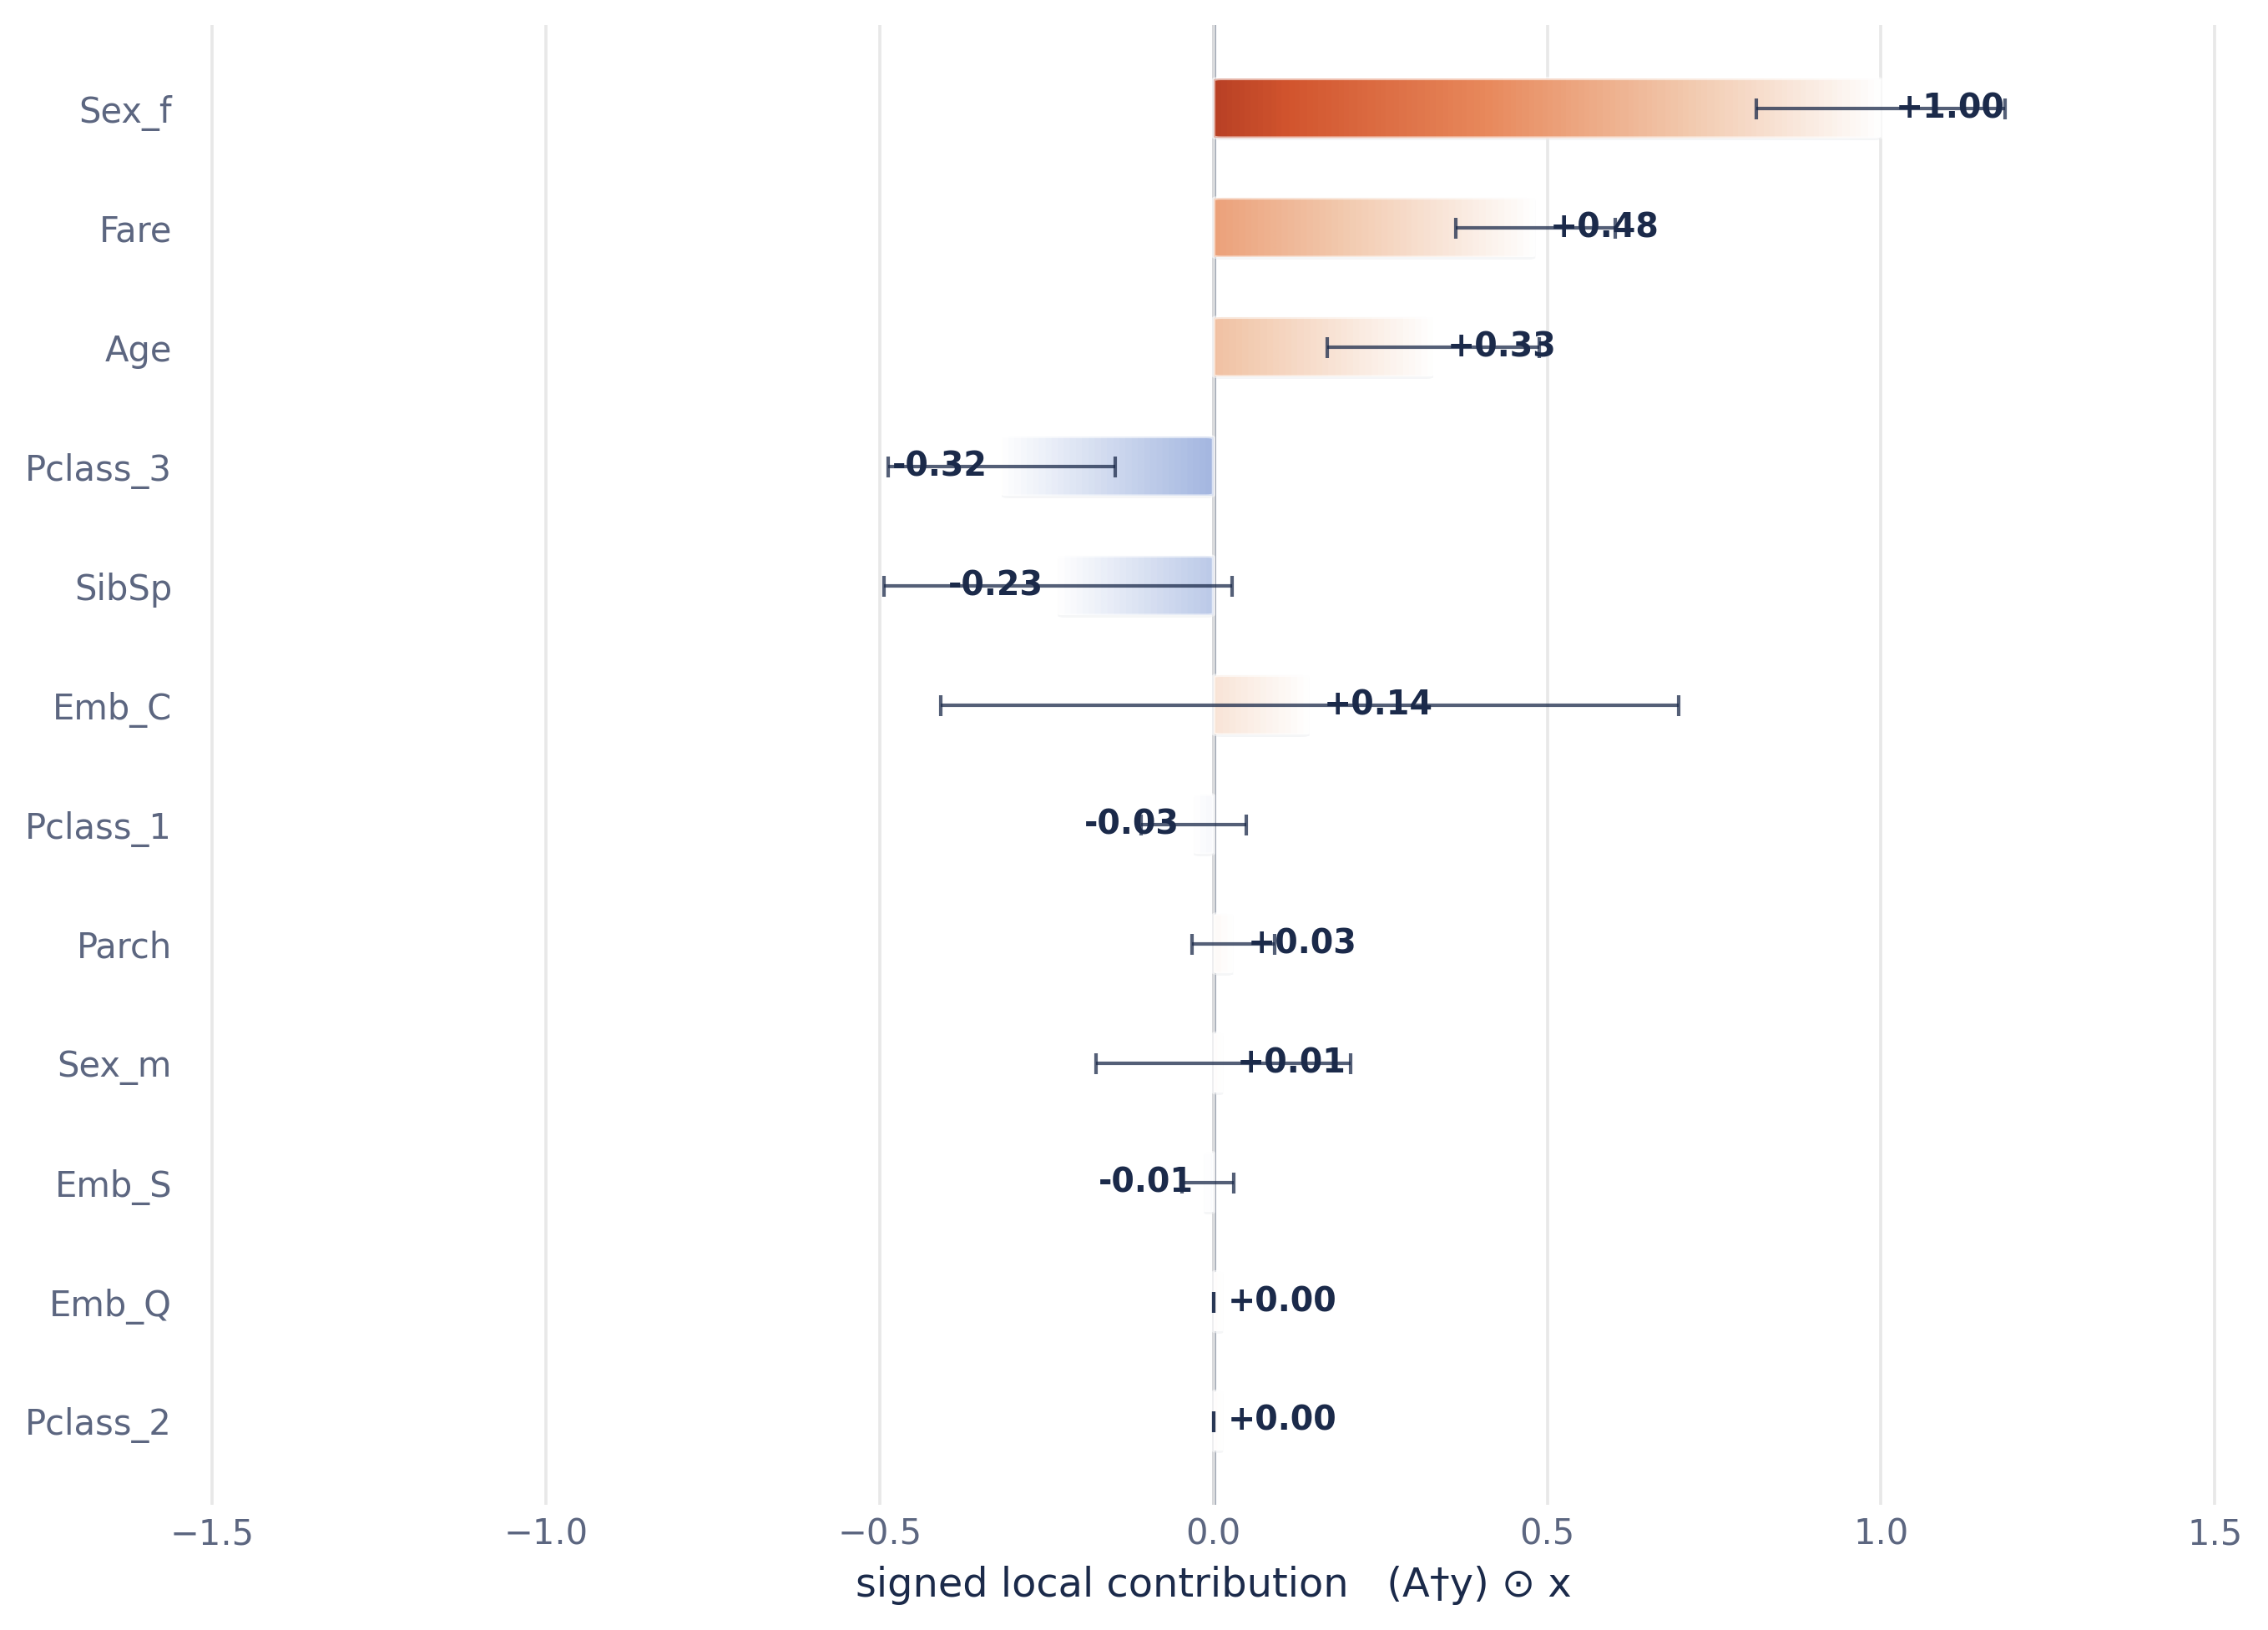
Local importance is the Hadamard product (A† y) ⊙ x'. Because it multiplies by
the instance, features that are zero in x get exactly zero importance.
explainer.local_feature_importance(
    jack, [0, 1], feature_names=feature_names, scaler=explainer.scaler,
    ignore_zero_features=True, top_k=5).round(2)
   Sex_female  Fare  Pclass_3  Embarked_Q  Embarked_S
0         1.0  0.82     -0.79        0.05        0.02
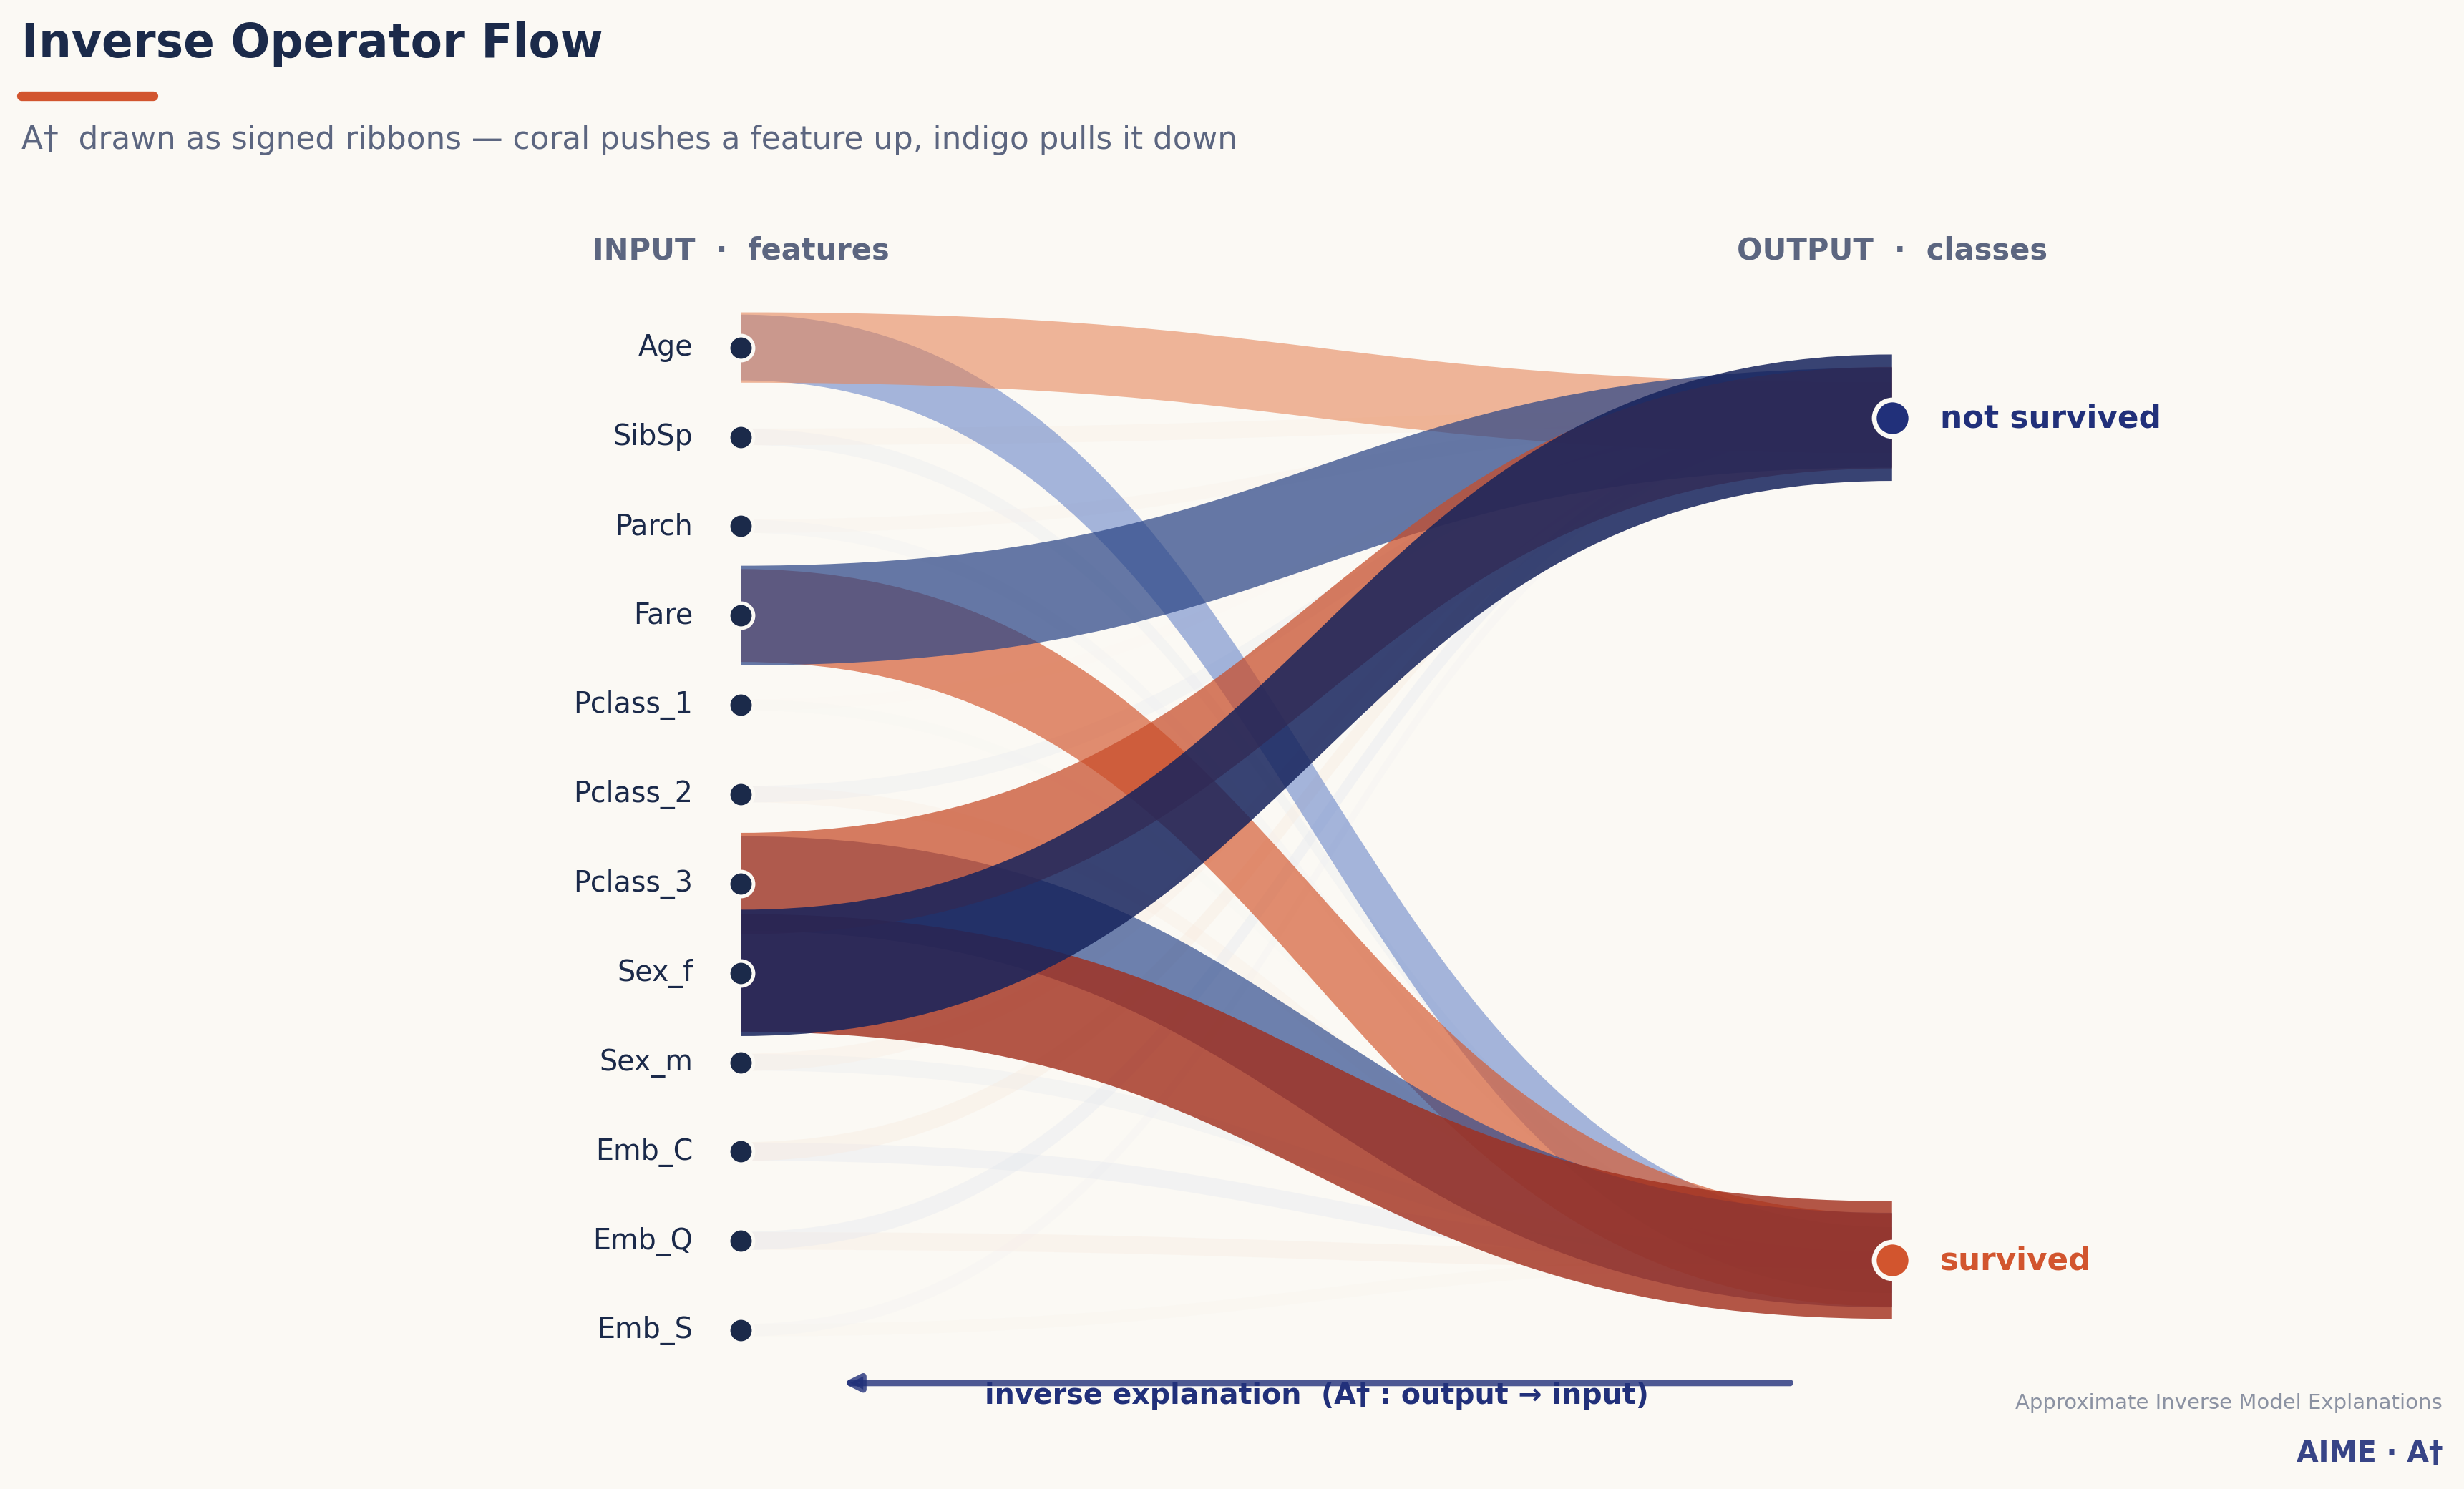
Inverse Operator Flow — A† itself, drawn as signed ribbons flowing
output → input (the inverse direction). Coral pushes a feature up, indigo pulls
it down; width = |weight|.
explainer.plot_inverse_operator_flow(feature_names=feature_names, class_names=class_names)
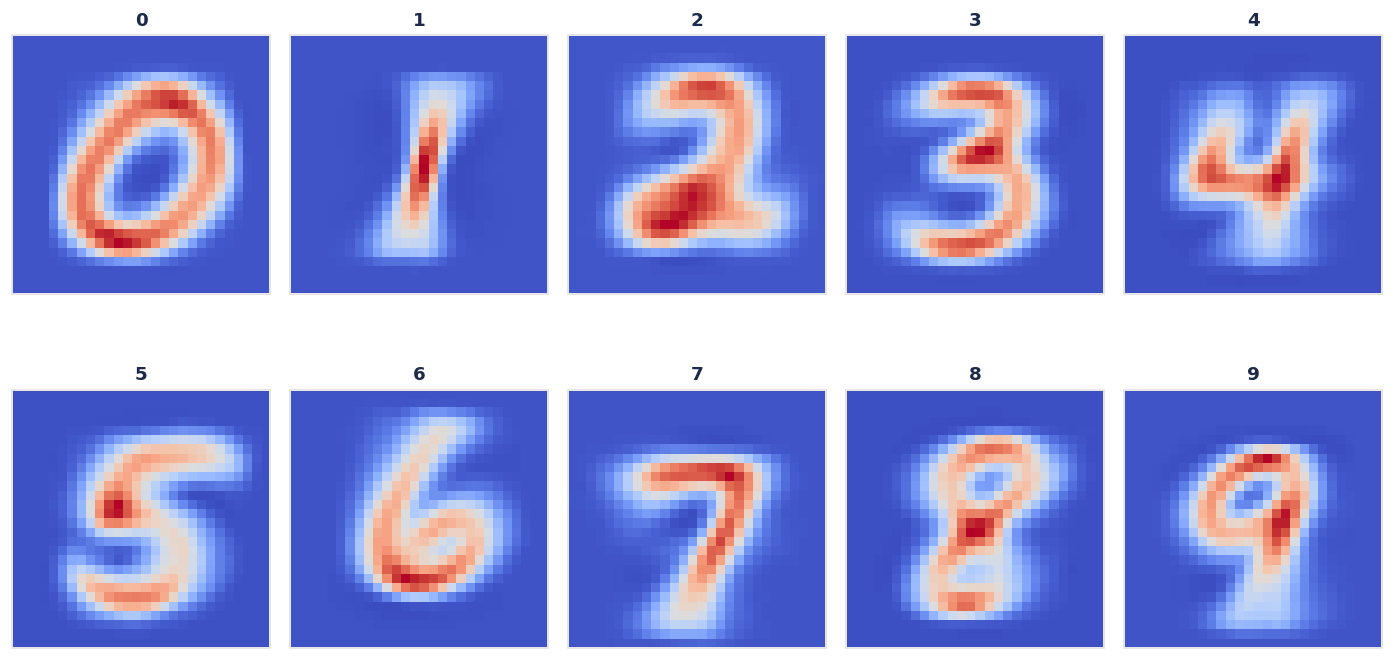
Representative estimation instances — A† eₜ, the ideal input the model
reconstructs for each class. For image models it reconstructs an ideal class
image; for tabular data, a feature fingerprint.
rep = explainer.representative_instance(scaler=explainer.scaler,
                                        feature_names=feature_names, class_names=class_names)
explainer.plot_representative_instance(scaler=explainer.scaler, image_shape=(28, 28))  # image models
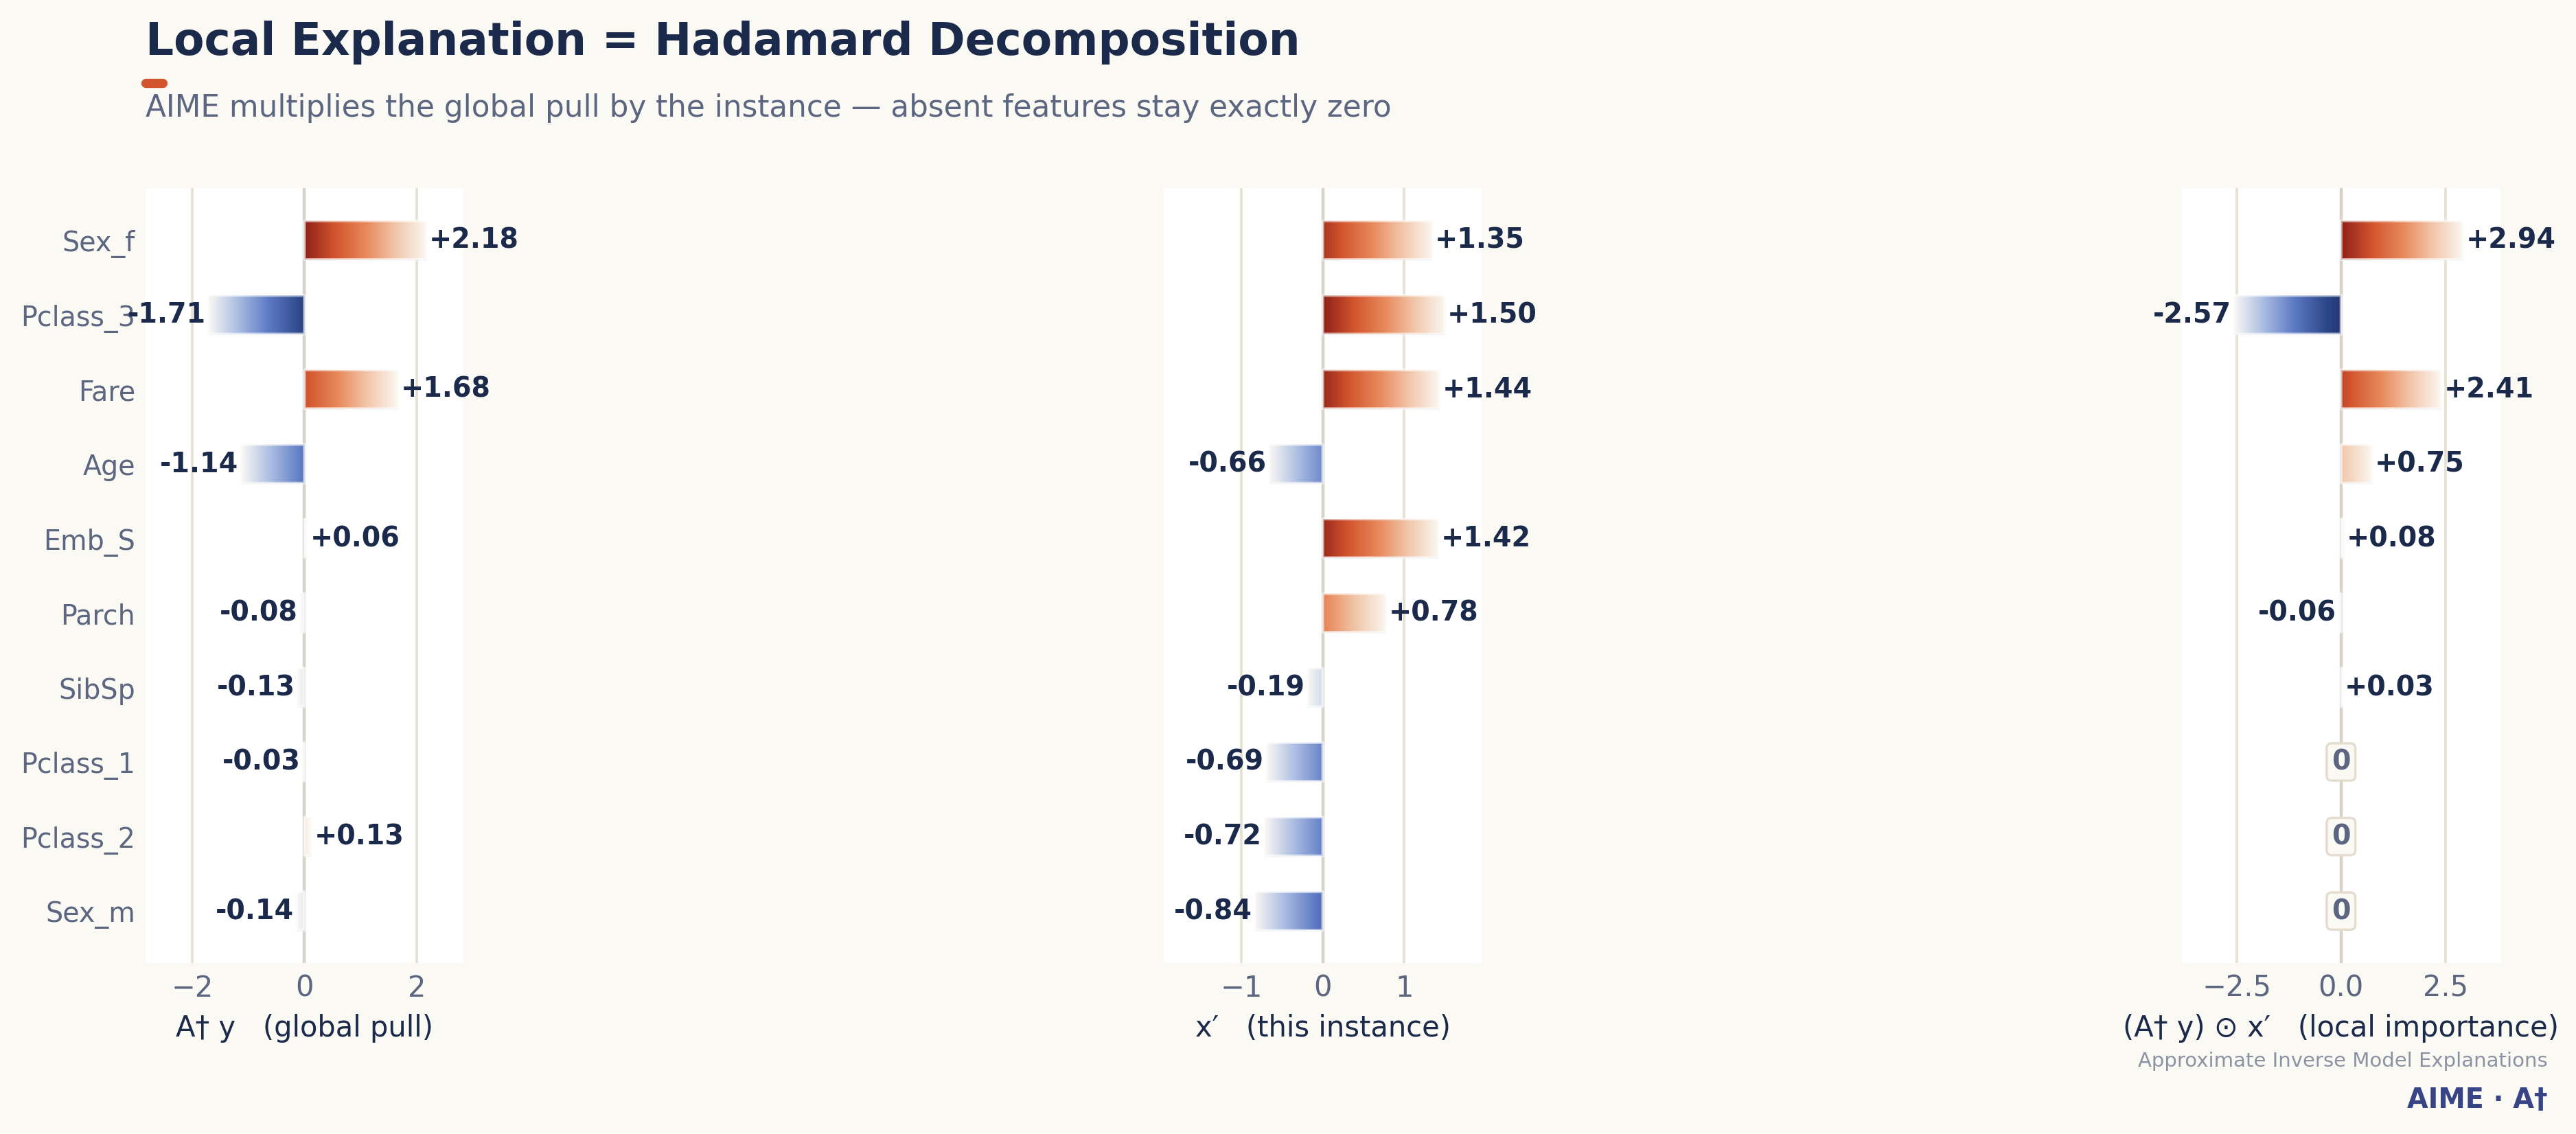
Local Hadamard decomposition — shows a local explanation being built as
global pull × instance; absent features visibly collapse to exactly zero.
explainer.plot_local_hadamard_decomposition(jack, np.array([0., 1.]),
                                             feature_names=feature_names, top_k=12)
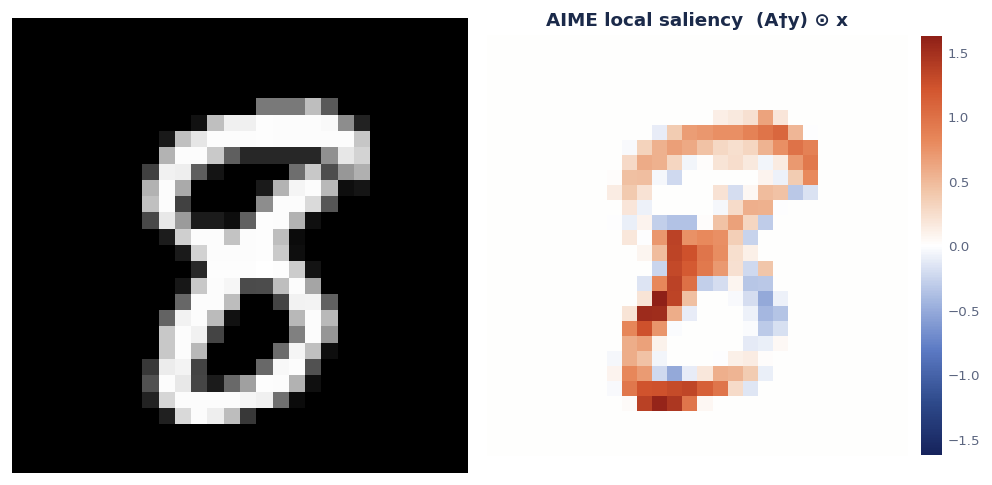
Local saliency (image models) — analytic saliency (A† y) ⊙ x reshaped onto
the image grid. No gradients, no perturbations.
explainer.plot_local_saliency(x, y, image_shape=(28, 28), scaler=explainer.scaler)
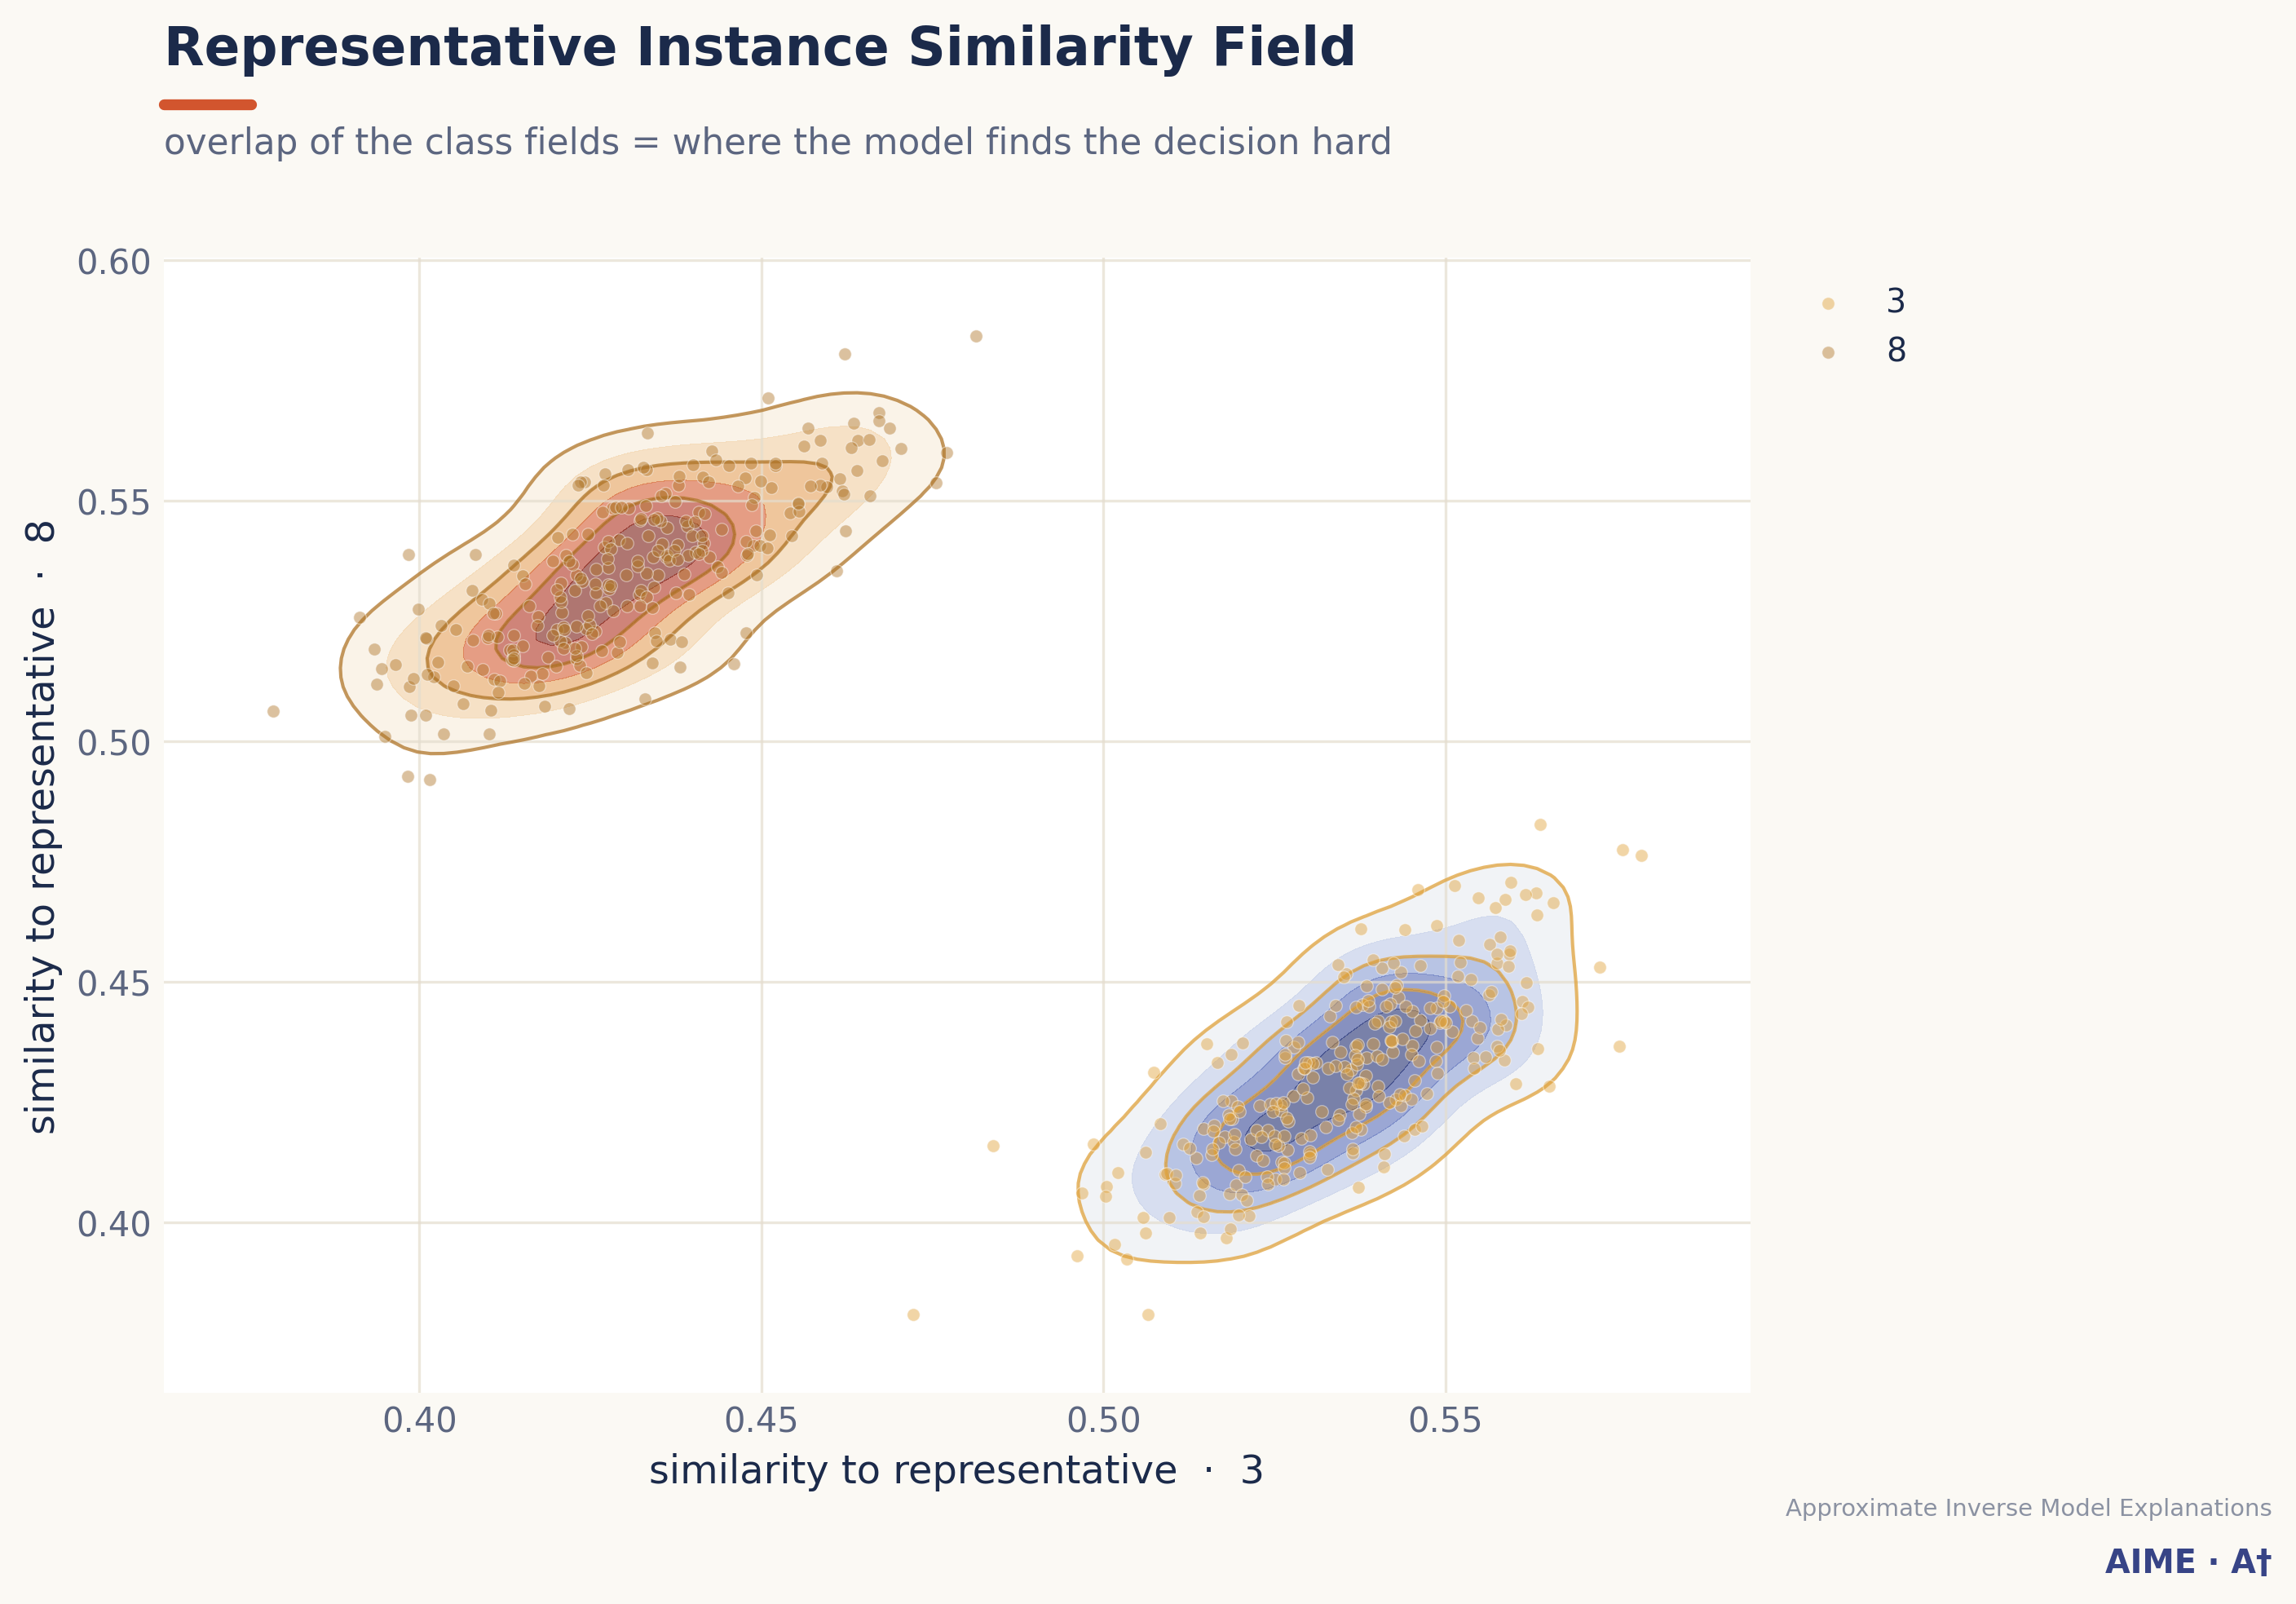
Representative instance similarity field — every point scored by RBF
similarity to two classes' representative instances; the overlap is where the
model finds the decision hard. Use gamma='scale' for high-dimensional inputs.
explainer.plot_rep_instance_similarity(
    X_test, y_hat_test, feature_names=feature_names, class_names=class_names,
    gamma='scale', class_indices=[3, 8])
BayesianAIME estimates a posterior over A†, so the importance plots carry
95% credible intervals and the returned frames hold mean / lower_bound / upper_bound.
bayes = AIME(use_bayesian=True, bayesian_sigma=1.0, bayesian_tau=1.0)
bayes.create_explainer(X_train, y_hat_train, normalize=True)

bayes.local_feature_importance(jack, [0, 1], feature_names=feature_names, top_k=4).round(2)
             Sex_female  Fare  Pclass_3  Embarked_Q
mean               1.00  0.82     -0.79        0.05
lower_bound        0.89  0.71     -0.90       -0.06
upper_bound        1.11  0.94     -0.67        0.16
| Global (per class) | Local (one instance) |
|---|---|
 |  |
Whether RidgeAIME visibly differs from AIME depends on the data:
λI competes with YᵀY, whose eigenvalues
scale with N. On Titanic (N≈700) they are ~10²–10³, so the default
λ=1e-3 changes the raw operator by only ~1e-5. Ridge becomes active once
λ reaches that band.A† by an almost-constant factor, and the per-class peak normalisation in
global_feature_importance divides it out — so even a large λ leaves the
normalised importance essentially unchanged (for ≥3 classes the cancellation
is only partial).To judge Ridge, compare the raw operator A_dagger (or sweep λ):
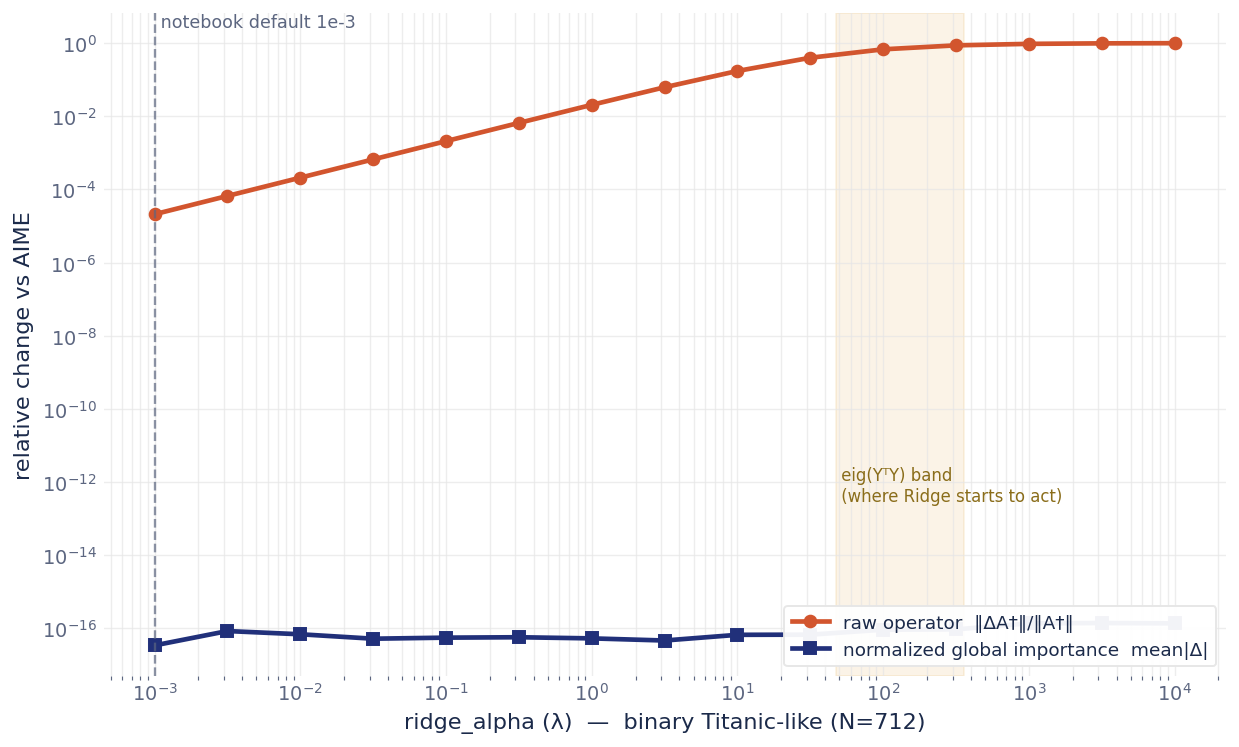
(raw-operator change rises with λ toward the eig(YᵀY) band; the normalised
global importance stays at machine-zero for binary tasks.)
Figures are publication-clean by default: white background, no title/subtitle headers, no brand mark — only in-figure captions (axis labels, legends, value labels, colorbars), so a figure drops straight into a paper. To restore the titled/branded look (e.g. for slides):
import aime_xai.style as S
S.set_publication_mode(False)
Both return a Colab/Jupyter object that displays inline when it is the last
expression in a cell; pass path=... to also save a standalone .html.
explainer.interactive_operator_flow(feature_names=feature_names, class_names=class_names)

# set a target output y with sliders → reconstruct the input x = scaler⁻¹(A†·y) live.
# image models morph an ideal-image canvas; tabular shows a standardized z = A†·y profile.
explainer.interactive_reconstruction(image_shape=(28, 28), class_names=class_names,
                                     path='aime_reconstruction.html')
All public class/method names and signatures match the canonical implementation,
so existing code keeps working; plotting methods only gain optional save_path /
show arguments.
AIME(...) · create_explainer · global_feature_importance ·
global_feature_importance_each · global_feature_importance_without_viz ·
local_feature_importance · local_feature_importance_without_viz ·
representative_instance · plot_representative_instance ·
plot_inverse_operator_flow · plot_local_hadamard_decomposition ·
plot_local_saliency · rbf_kernel · plot_rep_instance_similarity ·
interactive_operator_flow · interactive_reconstruction · export_interactive
AIME is dual-licensed under the 2-Clause BSD License and a Commercial License. Apply the 2-Clause BSD License only for academic or research purposes, and the Commercial License for commercial and other purposes — you choose which to use. For commercial licensing (a fee may apply), contact takafumi@eigenbeats.com.
If you use this software, please cite the relevant paper(s).
@ARTICLE{10247033,
  author={Nakanishi, Takafumi},
  journal={IEEE Access},
  title={Approximate Inverse Model Explanations (AIME): Unveiling Local and Global Insights in Machine Learning Models},
  year={2023}, volume={11}, pages={101020-101044},
  doi={10.1109/ACCESS.2023.3314336}}

@ARTICLE{10979913,
  author={Nakanishi, Takafumi},
  journal={IEEE Access},
  title={HuberAIME: A Robust Approach to Explainable AI in the Presence of Outliers},
  year={2025}, volume={13}, pages={76796-76810},
  doi={10.1109/ACCESS.2025.3565279}}

@INPROCEEDINGS{IIAI-AAI-Winter2025-RidgeAIME,
  author={Itoh, T. and Nakanishi, Takafumi},
  booktitle={2025 19th IIAI International Congress on Advanced Applied Informatics (IIAI-AAI-Winter)},
  title={Approximate Inverse Model Explanations for Metamaterial Design with Scalar-Field-Based Metal Foam Surrogates},
  year={2025}, pages={179-184}, address={Phuket, Thailand},
  doi={10.1109/IIAI-AAI-Winter69777.2025.00041}}

@ARTICLE{BayesianAIME2025,
  author={Nakanishi, Takafumi},
  journal={IEEE Access},
  title={Bayesian-AIME: Quantifying Uncertainty and Enhancing Stability in Approximate Inverse Model Explanations},
  year={2025},
  doi={10.1109/ACCESS.2025.3617984}}

@ARTICLE{10648696,
  author={Nakanishi, Takafumi},
  journal={IEEE Access},
  title={PCAIME: Principal Component Analysis-Enhanced Approximate Inverse Model Explanations Through Dimensional Decomposition and Expansion},
  year={2024}, volume={12}, pages={121093-121113},
  doi={10.1109/ACCESS.2024.3450299}}
Author: Takafumi Nakanishi · takafumi@eigenbeats.com
Download counts and popularity will appear here as the collector receives them.
| Version | Published | Direct dependencies | Open version |
|---|---|---|---|
| 1.2.0 | 18 Jun 2026 | 8 |
This describes our collected data; it is not a security assessment.
Observed since 21 Oct, 11:18 UTC
No superseded metadata states collected. Unchanged observations do not create new revisions.
package:e13e2eace2249d60a6e03e93ce7cfa9c154f21e136fd6f1a51812a2164eaf30f