
 Repository
Current collected state Current
Observed since 20 Oct, 18:43 UTC
No superseded metadata states collected. Unchanged observations do not create new revisions.
actxps
Create Actuarial Experience Studies: Prepare Data, Summarize Results, and Create Reports

The actxps package provides a set of tools to assist with the creation of actuarial experience studies. Experience studies are used by actuaries to explore historical experience across blocks of business and to inform assumption setting for projection models.
ExposedDF class converts census-level records into policy or
calendar year exposure records.exp_stats() method of ExposedDF creates ExpStats experience
summary objects containing observed termination rates and claims.
Optionally, expected termination rates, actual-to-expected ratios, and
limited fluctuation credibility estimates can also be returned.add_transactions() method of ExposedDF attaches summarized
transactions to an ExposedDF object.trx_stats() method of ExposedDF creates TrxStats transaction
summary objects containing transaction counts, amounts, frequencies,
and utilization. Optionally, transaction amounts can be expressed as a
percentage of one or more variables to calculate rates or
actual-to-expected ratios.plot() and table() methods of ExpStats and TrxStats create
plots and tables for reporting.exp_shiny() method of ExposedDF launches a Shiny app that
allows for interactive exploration of experience drivers.The actxps package can be installed from PyPI with:
$ pip install actxps
An expanded version of this demo is available at Getting started with actxps.
The actxps package includes simulated census data for a theoretical deferred annuity product with an optional guaranteed income rider. The grain of this data is one row per policy.
import actxps as xp
import numpy as np
import polars as pl

census_dat = xp.load_census_dat()
print(census_dat)
shape: (20_000, 11)
┌─────────┬───────────┬────────────┬──────────┬───┬────────┬────────┬─────────┬────────────┐
│ pol_num ┆ status    ┆ issue_date ┆ inc_guar ┆ … ┆ gender ┆ wd_age ┆ premium ┆ term_date  │
│ ---     ┆ ---       ┆ ---        ┆ ---      ┆   ┆ ---    ┆ ---    ┆ ---     ┆ ---        │
│ i64     ┆ cat       ┆ date       ┆ bool     ┆   ┆ cat    ┆ i64    ┆ f64     ┆ date       │
╞═════════╪═══════════╪════════════╪══════════╪═══╪════════╪════════╪═════════╪════════════╡
│ 1       ┆ Active    ┆ 2014-12-17 ┆ true     ┆ … ┆ F      ┆ 77     ┆ 370.0   ┆ null       │
│ 2       ┆ Surrender ┆ 2007-09-24 ┆ false    ┆ … ┆ F      ┆ 71     ┆ 708.0   ┆ 2019-03-08 │
│ 3       ┆ Active    ┆ 2012-10-06 ┆ false    ┆ … ┆ F      ┆ 63     ┆ 466.0   ┆ null       │
│ 4       ┆ Surrender ┆ 2005-06-27 ┆ true     ┆ … ┆ M      ┆ 62     ┆ 485.0   ┆ 2018-11-29 │
│ 5       ┆ Active    ┆ 2019-11-22 ┆ false    ┆ … ┆ F      ┆ 67     ┆ 978.0   ┆ null       │
│ …       ┆ …         ┆ …          ┆ …        ┆ … ┆ …      ┆ …      ┆ …       ┆ …          │
│ 19996   ┆ Active    ┆ 2014-08-11 ┆ true     ┆ … ┆ F      ┆ 75     ┆ 3551.0  ┆ null       │
│ 19997   ┆ Surrender ┆ 2006-11-20 ┆ false    ┆ … ┆ F      ┆ 77     ┆ 336.0   ┆ 2017-07-09 │
│ 19998   ┆ Surrender ┆ 2017-02-20 ┆ true     ┆ … ┆ F      ┆ 68     ┆ 1222.0  ┆ 2018-08-03 │
│ 19999   ┆ Active    ┆ 2015-04-11 ┆ false    ┆ … ┆ M      ┆ 78     ┆ 2138.0  ┆ null       │
│ 20000   ┆ Active    ┆ 2009-04-29 ┆ true     ┆ … ┆ M      ┆ 72     ┆ 5751.0  ┆ null       │
└─────────┴───────────┴────────────┴──────────┴───┴────────┴────────┴─────────┴────────────┘
Convert census records to exposure records with one row per policy per year.
exposed_data = xp.ExposedDF(census_dat,
                            end_date="2019-12-31",
                            target_status="Surrender")

exposed_data
Exposure data

Exposure type: policy_year
Target status: Surrender
Study range: 1900-01-01 to 2019-12-31

shape: (141_252, 15)
┌─────────┬────────┬────────────┬──────────┬───┬────────┬─────────────┬─────────────────┬──────────┐
│ pol_num ┆ status ┆ issue_date ┆ inc_guar ┆ … ┆ pol_yr ┆ pol_date_yr ┆ pol_date_yr_end ┆ exposure │
│ ---     ┆ ---    ┆ ---        ┆ ---      ┆   ┆ ---    ┆ ---         ┆ ---             ┆ ---      │
│ i64     ┆ enum   ┆ date       ┆ bool     ┆   ┆ u32    ┆ date        ┆ date            ┆ f64      │
╞═════════╪════════╪════════════╪══════════╪═══╪════════╪═════════════╪═════════════════╪══════════╡
│ 1       ┆ Active ┆ 2014-12-17 ┆ true     ┆ … ┆ 1      ┆ 2014-12-17  ┆ 2015-12-16      ┆ 1.0      │
│ 1       ┆ Active ┆ 2014-12-17 ┆ true     ┆ … ┆ 2      ┆ 2015-12-17  ┆ 2016-12-16      ┆ 1.0      │
│ 1       ┆ Active ┆ 2014-12-17 ┆ true     ┆ … ┆ 3      ┆ 2016-12-17  ┆ 2017-12-16      ┆ 1.0      │
│ 1       ┆ Active ┆ 2014-12-17 ┆ true     ┆ … ┆ 4      ┆ 2017-12-17  ┆ 2018-12-16      ┆ 1.0      │
│ 1       ┆ Active ┆ 2014-12-17 ┆ true     ┆ … ┆ 5      ┆ 2018-12-17  ┆ 2019-12-16      ┆ 1.0      │
│ …       ┆ …      ┆ …          ┆ …        ┆ … ┆ …      ┆ …           ┆ …               ┆ …        │
│ 20000   ┆ Active ┆ 2009-04-29 ┆ true     ┆ … ┆ 7      ┆ 2015-04-29  ┆ 2016-04-28      ┆ 1.0      │
│ 20000   ┆ Active ┆ 2009-04-29 ┆ true     ┆ … ┆ 8      ┆ 2016-04-29  ┆ 2017-04-28      ┆ 1.0      │
│ 20000   ┆ Active ┆ 2009-04-29 ┆ true     ┆ … ┆ 9      ┆ 2017-04-29  ┆ 2018-04-28      ┆ 1.0      │
│ 20000   ┆ Active ┆ 2009-04-29 ┆ true     ┆ … ┆ 10     ┆ 2018-04-29  ┆ 2019-04-28      ┆ 1.0      │
│ 20000   ┆ Active ┆ 2009-04-29 ┆ true     ┆ … ┆ 11     ┆ 2019-04-29  ┆ 2020-04-28      ┆ 0.674863 │
└─────────┴────────┴────────────┴──────────┴───┴────────┴─────────────┴─────────────────┴──────────┘
Create a summary grouped by policy year and the presence of a guaranteed income rider.
exp_res = (exposed_data.
           group_by('pol_yr', 'inc_guar').
           exp_stats())

exp_res
Experience study results

Groups: pol_yr, inc_guar
Target status: Surrender
Study range: 1900-01-01 to 2019-12-31

shape: (30, 6)
┌────────┬──────────┬──────────┬────────┬──────────────┬──────────┐
│ pol_yr ┆ inc_guar ┆ n_claims ┆ claims ┆ exposure     ┆ q_obs    │
│ ---    ┆ ---      ┆ ---      ┆ ---    ┆ ---          ┆ ---      │
│ u32    ┆ bool     ┆ u32      ┆ u32    ┆ f64          ┆ f64      │
╞════════╪══════════╪══════════╪════════╪══════════════╪══════════╡
│ 1      ┆ false    ┆ 56       ┆ 56     ┆ 7719.80774   ┆ 0.007254 │
│ 1      ┆ true     ┆ 46       ┆ 46     ┆ 11532.404626 ┆ 0.003989 │
│ 2      ┆ false    ┆ 92       ┆ 92     ┆ 7102.81316   ┆ 0.012953 │
│ 2      ┆ true     ┆ 68       ┆ 68     ┆ 10611.967258 ┆ 0.006408 │
│ 3      ┆ false    ┆ 67       ┆ 67     ┆ 6446.916146  ┆ 0.010393 │
│ …      ┆ …        ┆ …        ┆ …      ┆ …            ┆ …        │
│ 13     ┆ true     ┆ 49       ┆ 49     ┆ 1117.137361  ┆ 0.043862 │
│ 14     ┆ false    ┆ 33       ┆ 33     ┆ 262.622262   ┆ 0.125656 │
│ 14     ┆ true     ┆ 29       ┆ 29     ┆ 609.216476   ┆ 0.047602 │
│ 15     ┆ false    ┆ 8        ┆ 8      ┆ 74.050109    ┆ 0.108035 │
│ 15     ┆ true     ┆ 9        ┆ 9      ┆ 194.128602   ┆ 0.046361 │
└────────┴──────────┴──────────┴────────┴──────────────┴──────────┘
Calculate actual-to-expected ratios.
First, attach one or more columns of expected termination rates to the
exposure data. Then, pass these column names to the expected argument
of exp_stats().
expected_table = np.concatenate((
    np.linspace(0.005, 0.03, 10),
    np.array([0.2, 0.15]),
    np.repeat(0.05, 3)
    ))

# using 2 different expected termination rates
exposed_data.data = exposed_data.data.with_columns(
    expected_1=expected_table[exposed_data.data['pol_yr'] - 1],
    expected_2=pl.when(pl.col('inc_guar')).then(0.015).otherwise(0.03)
)

exp_res = (exposed_data.
           group_by('pol_yr', 'inc_guar').
           exp_stats(expected = ["expected_1", "expected_2"]))

exp_res
Experience study results

Groups: pol_yr, inc_guar
Target status: Surrender
Study range: 1900-01-01 to 2019-12-31
Expected values: expected_1, expected_2

shape: (30, 10)
┌────────┬──────────┬──────────┬────────┬───┬────────────┬────────────┬──────────────┬─────────────┐
│ pol_yr ┆ inc_guar ┆ n_claims ┆ claims ┆ … ┆ expected_1 ┆ expected_2 ┆ ae_expected_ ┆ ae_expected │
│ ---    ┆ ---      ┆ ---      ┆ ---    ┆   ┆ ---        ┆ ---        ┆ 1            ┆ _2          │
│ u32    ┆ bool     ┆ u32      ┆ u32    ┆   ┆ f64        ┆ f64        ┆ ---          ┆ ---         │
│        ┆          ┆          ┆        ┆   ┆            ┆            ┆ f64          ┆ f64         │
╞════════╪══════════╪══════════╪════════╪═══╪════════════╪════════════╪══════════════╪═════════════╡
│ 1      ┆ false    ┆ 56       ┆ 56     ┆ … ┆ 0.005      ┆ 0.03       ┆ 1.450813     ┆ 0.241802    │
│ 1      ┆ true     ┆ 46       ┆ 46     ┆ … ┆ 0.005      ┆ 0.015      ┆ 0.797752     ┆ 0.265917    │
│ 2      ┆ false    ┆ 92       ┆ 92     ┆ … ┆ 0.007778   ┆ 0.03       ┆ 1.665336     ┆ 0.431754    │
│ 2      ┆ true     ┆ 68       ┆ 68     ┆ … ┆ 0.007778   ┆ 0.015      ┆ 0.823868     ┆ 0.427191    │
│ 3      ┆ false    ┆ 67       ┆ 67     ┆ … ┆ 0.010556   ┆ 0.03       ┆ 0.984559     ┆ 0.346419    │
│ …      ┆ …        ┆ …        ┆ …      ┆ … ┆ …          ┆ …          ┆ …            ┆ …           │
│ 13     ┆ true     ┆ 49       ┆ 49     ┆ … ┆ 0.05       ┆ 0.015      ┆ 0.877242     ┆ 2.924141    │
│ 14     ┆ false    ┆ 33       ┆ 33     ┆ … ┆ 0.05       ┆ 0.03       ┆ 2.513115     ┆ 4.188525    │
│ 14     ┆ true     ┆ 29       ┆ 29     ┆ … ┆ 0.05       ┆ 0.015      ┆ 0.952043     ┆ 3.173475    │
│ 15     ┆ false    ┆ 8        ┆ 8      ┆ … ┆ 0.05       ┆ 0.03       ┆ 2.160699     ┆ 3.601165    │
│ 15     ┆ true     ┆ 9        ┆ 9      ┆ … ┆ 0.05       ┆ 0.015      ┆ 0.92722      ┆ 3.090735    │
└────────┴──────────┴──────────┴────────┴───┴────────────┴────────────┴──────────────┴─────────────┘
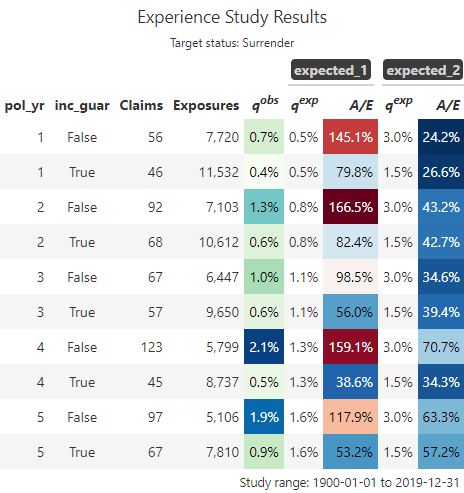
Create visualizations using the plot() and table() methods.
exp_res.plot()
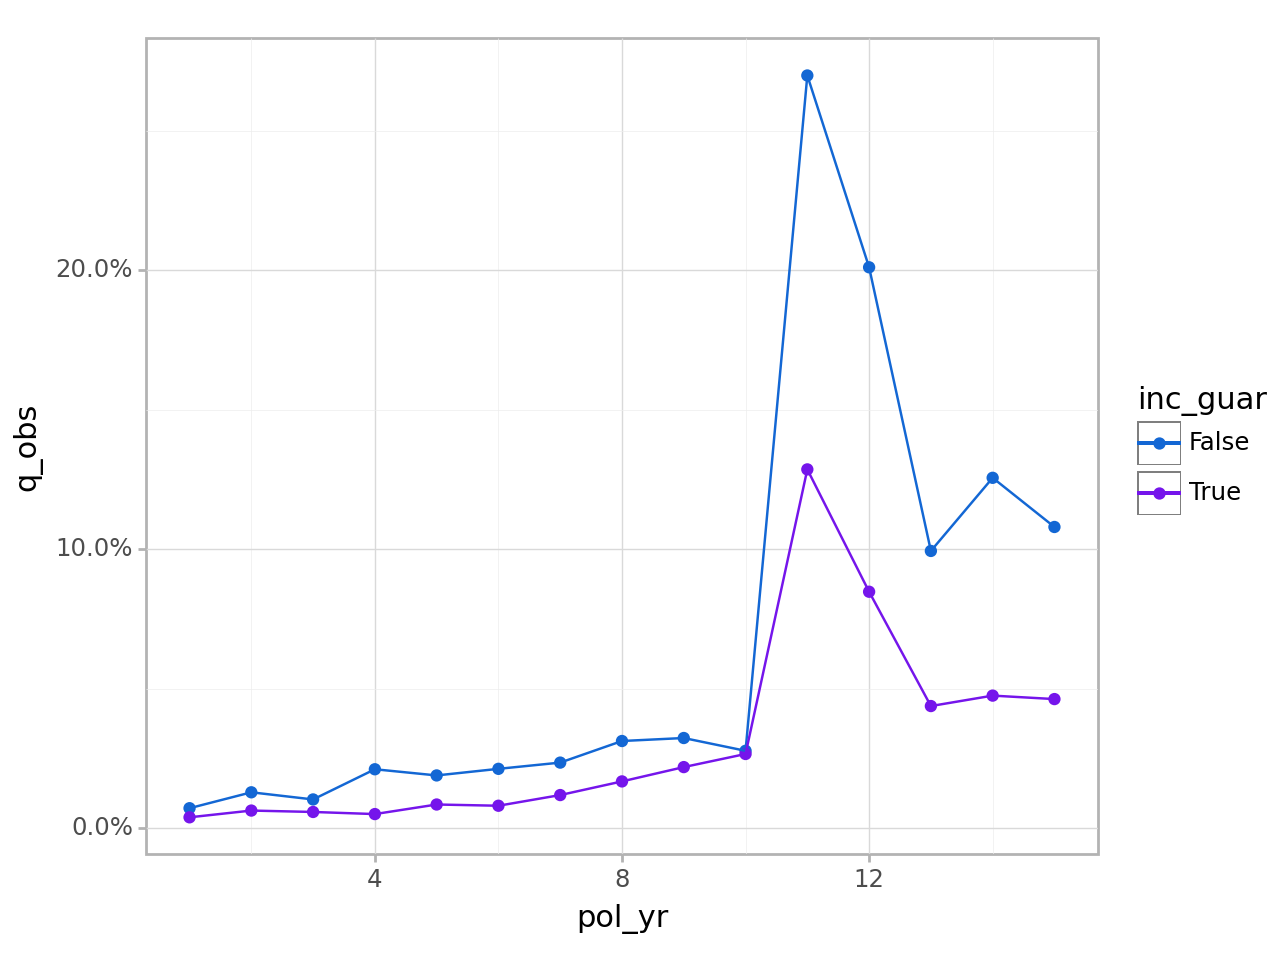
<Figure Size: (640 x 480)>
# first 10 rows showed for brevity
exp_res.table()
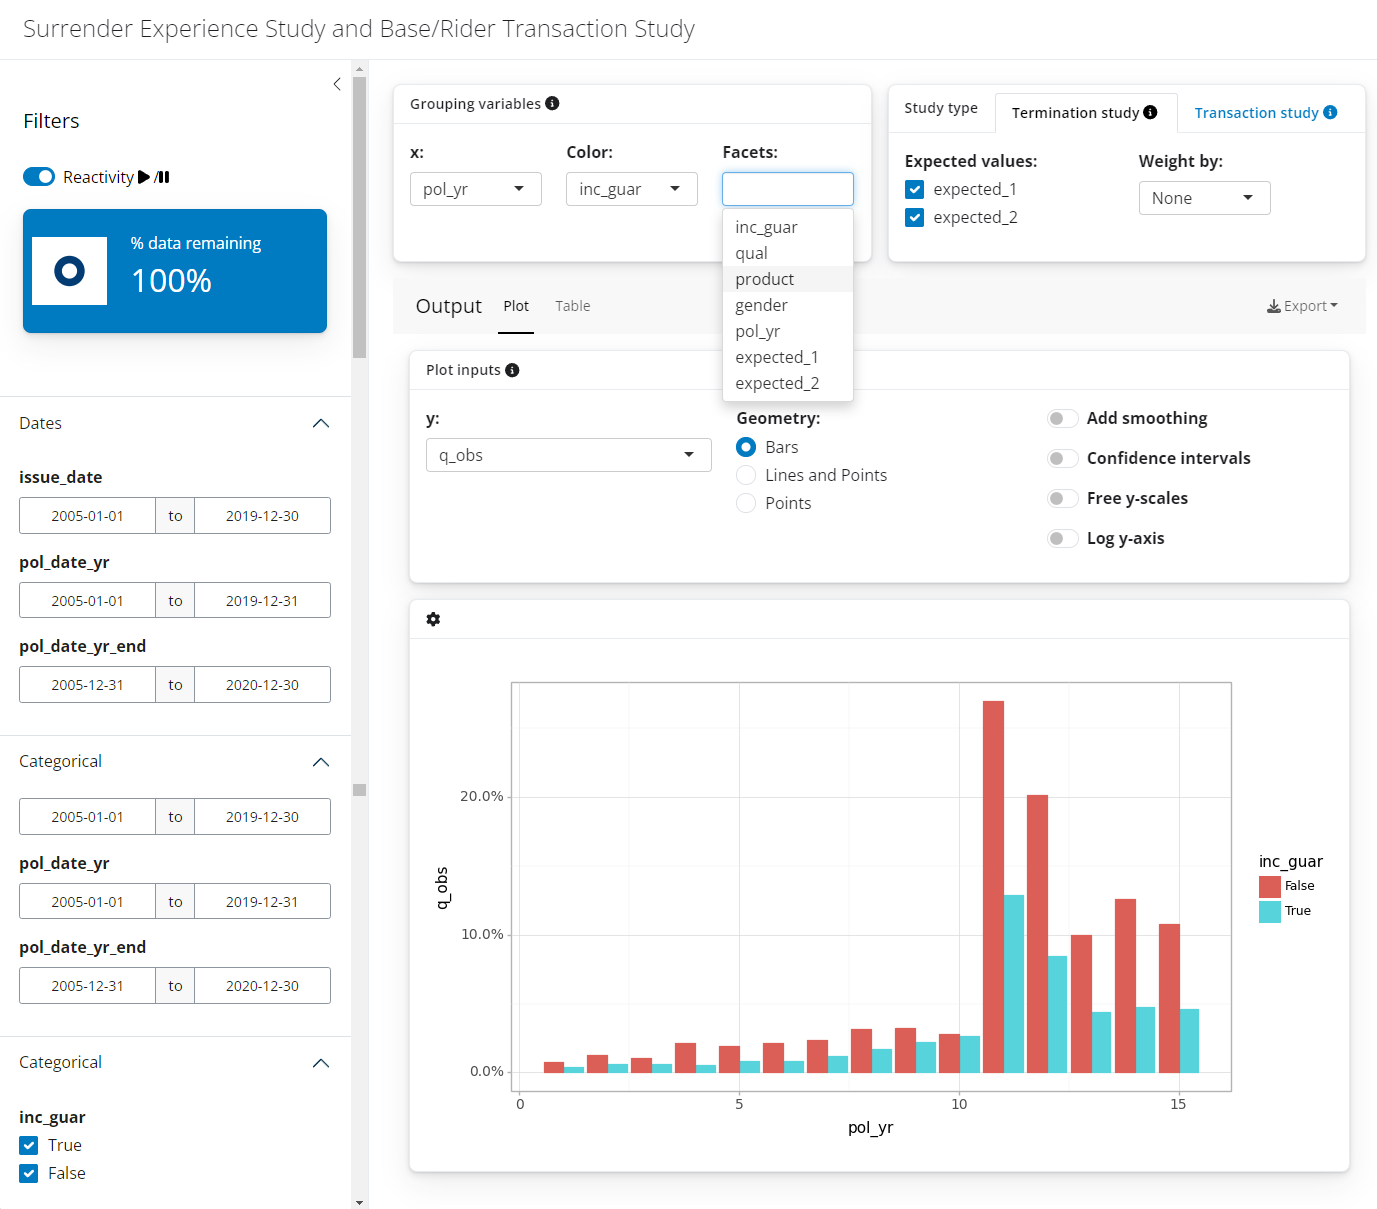
Launch a shiny app to interactively explore experience data.
exposed_data.exp_shiny()
Logo
Image by macrovector on Freepik
Download counts and popularity will appear here as the collector receives them.
| Package / target | Requirement | Relationship |
|---|---|---|
numpyEnvironment{
"extras": "",
"marker": null,
"requires_python": ">=3.10",
"evaluation": "NOT_EVALUATED"
} | numpy>=1.26.2 | runtime |
pandasEnvironment{
"extras": "",
"marker": null,
"requires_python": ">=3.10",
"evaluation": "NOT_EVALUATED"
} | pandas>=2.1.4 | runtime |
plotnineEnvironment{
"extras": "",
"marker": null,
"requires_python": ">=3.10",
"evaluation": "NOT_EVALUATED"
} | plotnine>=0.12.4 | runtime |
joblibEnvironment{
"extras": "",
"marker": null,
"requires_python": ">=3.10",
"evaluation": "NOT_EVALUATED"
} | joblib>=1.3.2 | runtime |
scipyEnvironment{
"extras": "",
"marker": null,
"requires_python": ">=3.10",
"evaluation": "NOT_EVALUATED"
} | scipy>=1.11.4 | runtime |
matplotlibEnvironment{
"extras": "",
"marker": null,
"requires_python": ">=3.10",
"evaluation": "NOT_EVALUATED"
} | matplotlib>=3.8.2 | runtime |
shinyEnvironment{
"extras": "",
"marker": null,
"requires_python": ">=3.10",
"evaluation": "NOT_EVALUATED"
} | shiny>=0.7.0 | runtime |
great-tablesEnvironment{
"extras": "",
"marker": null,
"requires_python": ">=3.10",
"evaluation": "NOT_EVALUATED"
} | great-tables>=0.3.1 | runtime |
shinyswatchEnvironment{
"extras": "",
"marker": null,
"requires_python": ">=3.10",
"evaluation": "NOT_EVALUATED"
} | shinyswatch>=0.4.2 | runtime |
faiconsEnvironment{
"extras": "",
"marker": null,
"requires_python": ">=3.10",
"evaluation": "NOT_EVALUATED"
} | faicons>=0.2.2 | runtime |
scikit-miscEnvironment{
"extras": "",
"marker": null,
"requires_python": ">=3.10",
"evaluation": "NOT_EVALUATED"
} | scikit-misc>=0.3.1 | runtime |
polarsEnvironment{
"extras": "",
"marker": null,
"requires_python": ">=3.10",
"evaluation": "NOT_EVALUATED"
} | polars>=0.20.9 | runtime |
seleniumEnvironment{
"extras": "",
"marker": null,
"requires_python": ">=3.10",
"evaluation": "NOT_EVALUATED"
} | selenium<5.0.0,>=4.18.1 | runtime |
pyarrowEnvironment{
"extras": "",
"marker": null,
"requires_python": ">=3.10",
"evaluation": "NOT_EVALUATED"
} | pyarrow>=15.0.0 | runtime |
bdist_wheel · 1,181.03 KB · Python py3
sdist · 1,177.79 KB · Python source
Observed since 20 Oct, 18:43 UTC
No superseded metadata states collected. Unchanged observations do not create new revisions.
package_version:b1afbe3f5ce6c2e54a036647a86609cd6a8a46e0c8c9459cae0afa5cc669ee04